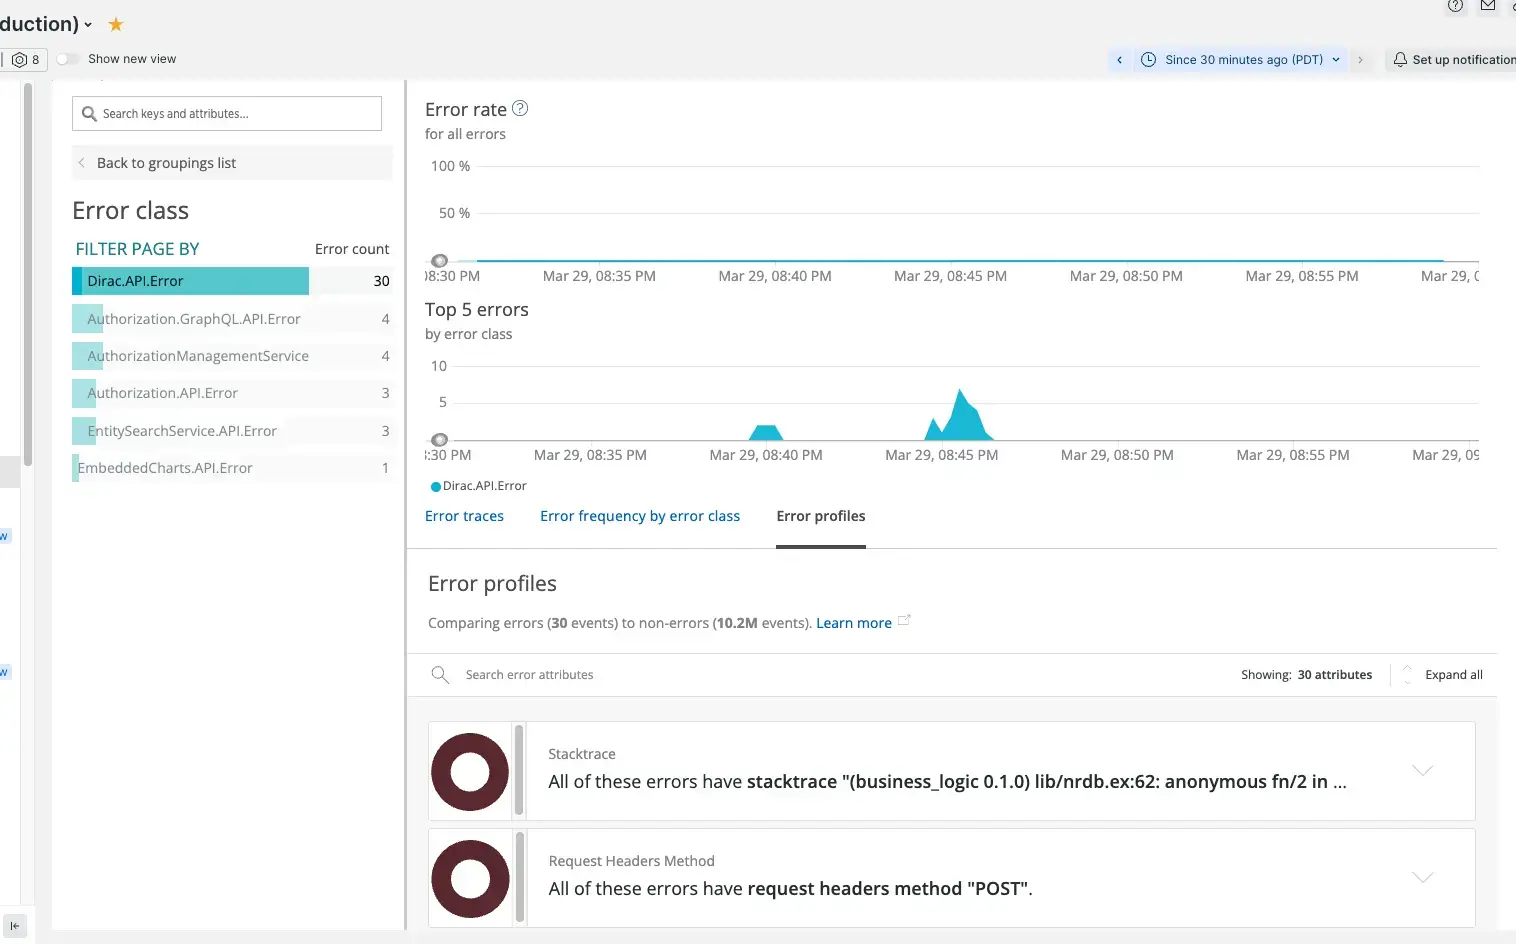
With the Errors UI, you can see the line of code that's causing a bad experience for your users, and get enough data to reproduce the issue so you can fix it. When you do, you'll be able to confirm your fix is working in production.
Use the Errors tab to:
- Group and filter events to triage important errors.
- Get alert notifications about errors.
- Review stack traces, logs, and other details.
- Share the error information with charts and dashboards.
- Report new errors using instrumentation, prevent certain errors from being reported, and filter out noisy errors using expected errors.
Error profiles: Troubleshoot trends
When DevOps experts need to track down what causes errors in your app, it may not be easy to identify the cause. APM's error profiles automatically compare one set of events to another.
Each error profile provides visual details about significant differences in the frequency of different values for the events. For each attribute, the error profile includes:
- A pie chart showing how the error's attribute is distributed for values that deviate the most
- A table comparing the error attribute's distribution to that of non-erroring transactions
This helps you take more of the guesswork out of resolving your app errors. You can more easily determine if you can safely ignore the error, or if you should attempt to resolve the error with a new deployment, code edits, customer communications, or other actions.
Error profile attribute examples
To access error profiles go to one.newrelic.com > All capabilities > APM & services > Errors > Error profiles

Use error profiles to troubleshoot trends and significant differences in the frequency of error events for your app.
An error profile is a collection of attributes with significantly different traits compared to non-errors. An attribute is "unusual" if a set of events represent what is normal (for example, errors compared to all traffic for a given time window), or differences between similar criteria (for example, two different hosts).
Errors may be related to events such as:
- Specific web transaction names or non-web transaction names, JVM thread names, etc.
- Unique types of error messages, classes, etc.
- Random customer interactions; for example, a particular error comes from a single customer's account, while normal traffic comes from a wide variety of accounts
- External call counts or duration
- Timing differences among hosts in your ecosystem, cluster agent IDs, etc.
- Other anomalies
Select error profile criteria
Based on criteria in your app's Errors page, New Relic analyzes and lists unusual trends by their significance. Your selected criteria includes:
- Time window
- Errors page filters
- Search criteria on the Errors page or the Error profiles tab
As you examine error profile results and want to dig deeper, add or change your app's error profile criteria. The Error profile tab refreshes to show the traits that distinguish the errors that match the updated criteria.
Analyze error profile results
To examine details for the attribute results in your app's error profile, you must use the classic APM view.
- Go to one.newrelic.com > All capabilities > APM & services > (select an app) > Events > Errors, then toggle Show new view so that APM shows the classic view of the Errors page.
- From the Errors page, select the Error profile tab.
- From the Error profile tab, review the list of error attributes that match the currently selected error profile criteria.
- To view a specific attribute's details, click it.
- To highlight specific error details, mouse over any pie chart segment or table row for the attribute.
- To investigate a specific attribute for your app's errors, type its name in the Error profiles tab's search window, or change the currently selected error profile criteria.
Compare values with large differences to identify the traits that distinguish the errors for an attribute. The comparative data in the error profile results and the error trace details can help you decide what steps to take for additional troubleshooting and resolving the error.
Error and non-error distribution
Depending on an error's attributes, sometimes the attribute is distributed differently for errors than for non-errors.