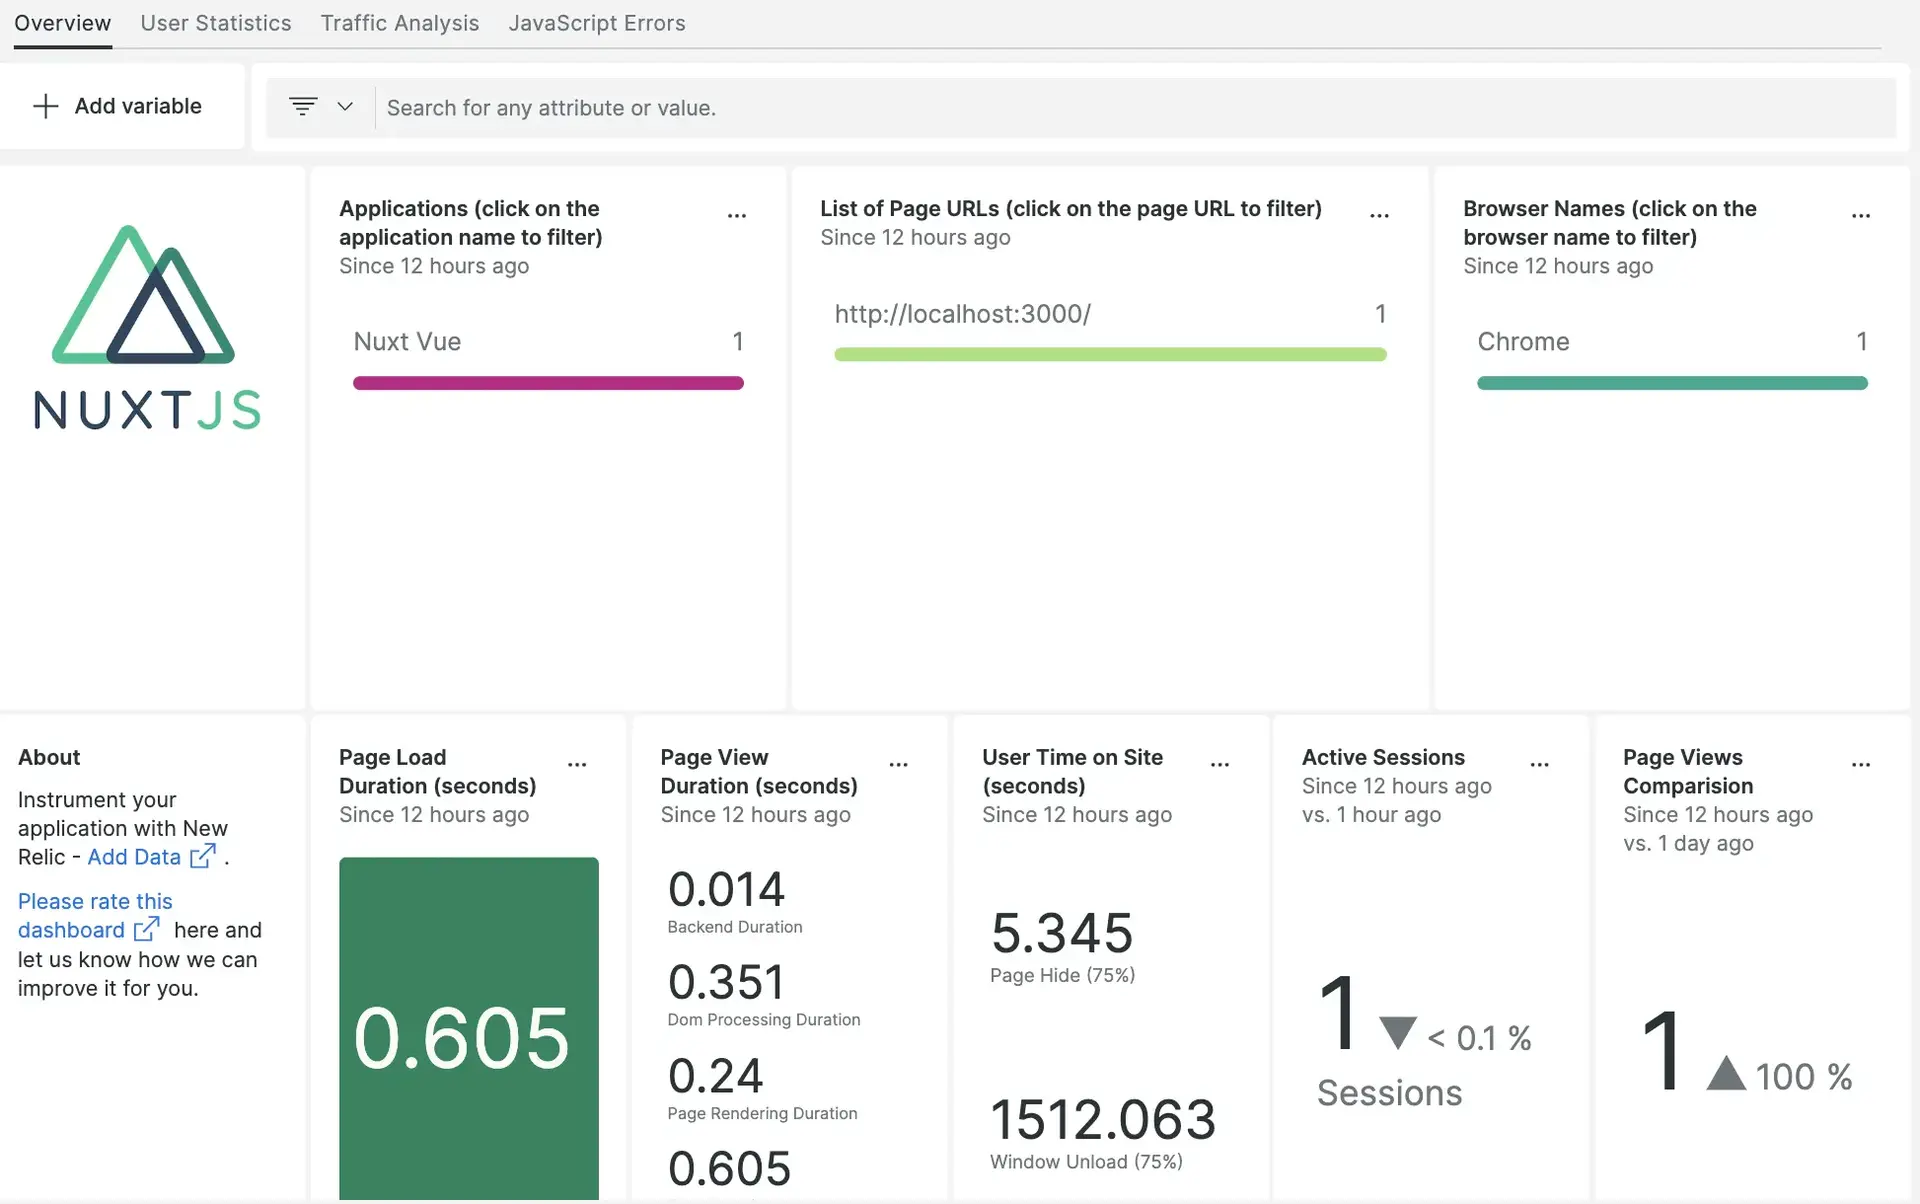
With our Nuxt.js dashboard, you can easily track your application error rate, initial page load average, route changes, throughput, and page views with JavaScript errors. Built with our infrastructure agent and our Vue , the Nuxt.js dashboard lets you view critical information all in one place.

1. Install infrastructure agent
Before you can get your data into New Relic, you should first install the infrastructure agent (if you have it installed, you can skip this step). This enables New Relic to collect data so that application error rates, throughput, and page views with JavaScript errors can appear in dashboards. This step is optional, but we strongly recommend you install the infrastructure agent to see all your host and browser monitoring data.
There are two ways to install the infrastructure agent:
- Follow the guided install to instrument our system with the infrastructure agent.
- Install the infrastructure agent using the command line.
2. Install Vue browser monitoring
After installing the infrastructure agent, the next step is to install the browser monitor. From one.newrelic.com:
- Click Integrations & Agents
- Click Browser & mobile
- Click Vue From there, follow the instructions to generate the JavaScript code snippet used in step 3. While the browser monitoring agent and the Vue integration provide essentially the same service, the Vue integration is specific to JavaScript (which is the framework of Nuxt.js). If you'd like to monitor other, non JavaScript-specific services, you should use the browser monitoring agent.
3. Configure the integration
To add the JavaScript snippet in the Nuxt.js application:
- Create a JavaScript file in the
staticfolder of your nuxt.js application:bash$touch <FILENAME>.js - Create a function in the newly created JavaScript file and add the generated script within the function:function FUNCTION_NAME() {// GENERATED SCRIPT IS PASTED HERE BY REMOVING OPENING AND CLOSING <script> TAGS>}FUNCTION_NAME();
- Copy the code snippet below and paste it in
HEADER tagofnuxt.config.jsfile and update function name and file name:__dangerouslyDisableSanitizers: ["script"],script: [{hid: "<FUNCTION_NAME>",src: "/<FILENAME>.js",defer: true,type: "text/javascript",charset: "utf-8",},], - Restart your application.
4. Monitor your application on one.newrelic.com
Now, you should be able to see your application on one.newrelic.com by selecting Browser from the navigation bar. Choose your application to see all the metrics which are captured on the one.newrelic.com platform. You can also view the data with NRQL using the following query:
SELECT firstPaint FROM PageViewWhat's next?
To learn more about building NRQL queries and generating dashboards, check out these docs:
- Introduction to the query builder to create basic and advanced queries.
- Introduction to dashboards to customize your dashboard and carry out different actions.
- Manage your dashboard to adjust the display mode for your , or to add more content to your dashboards.