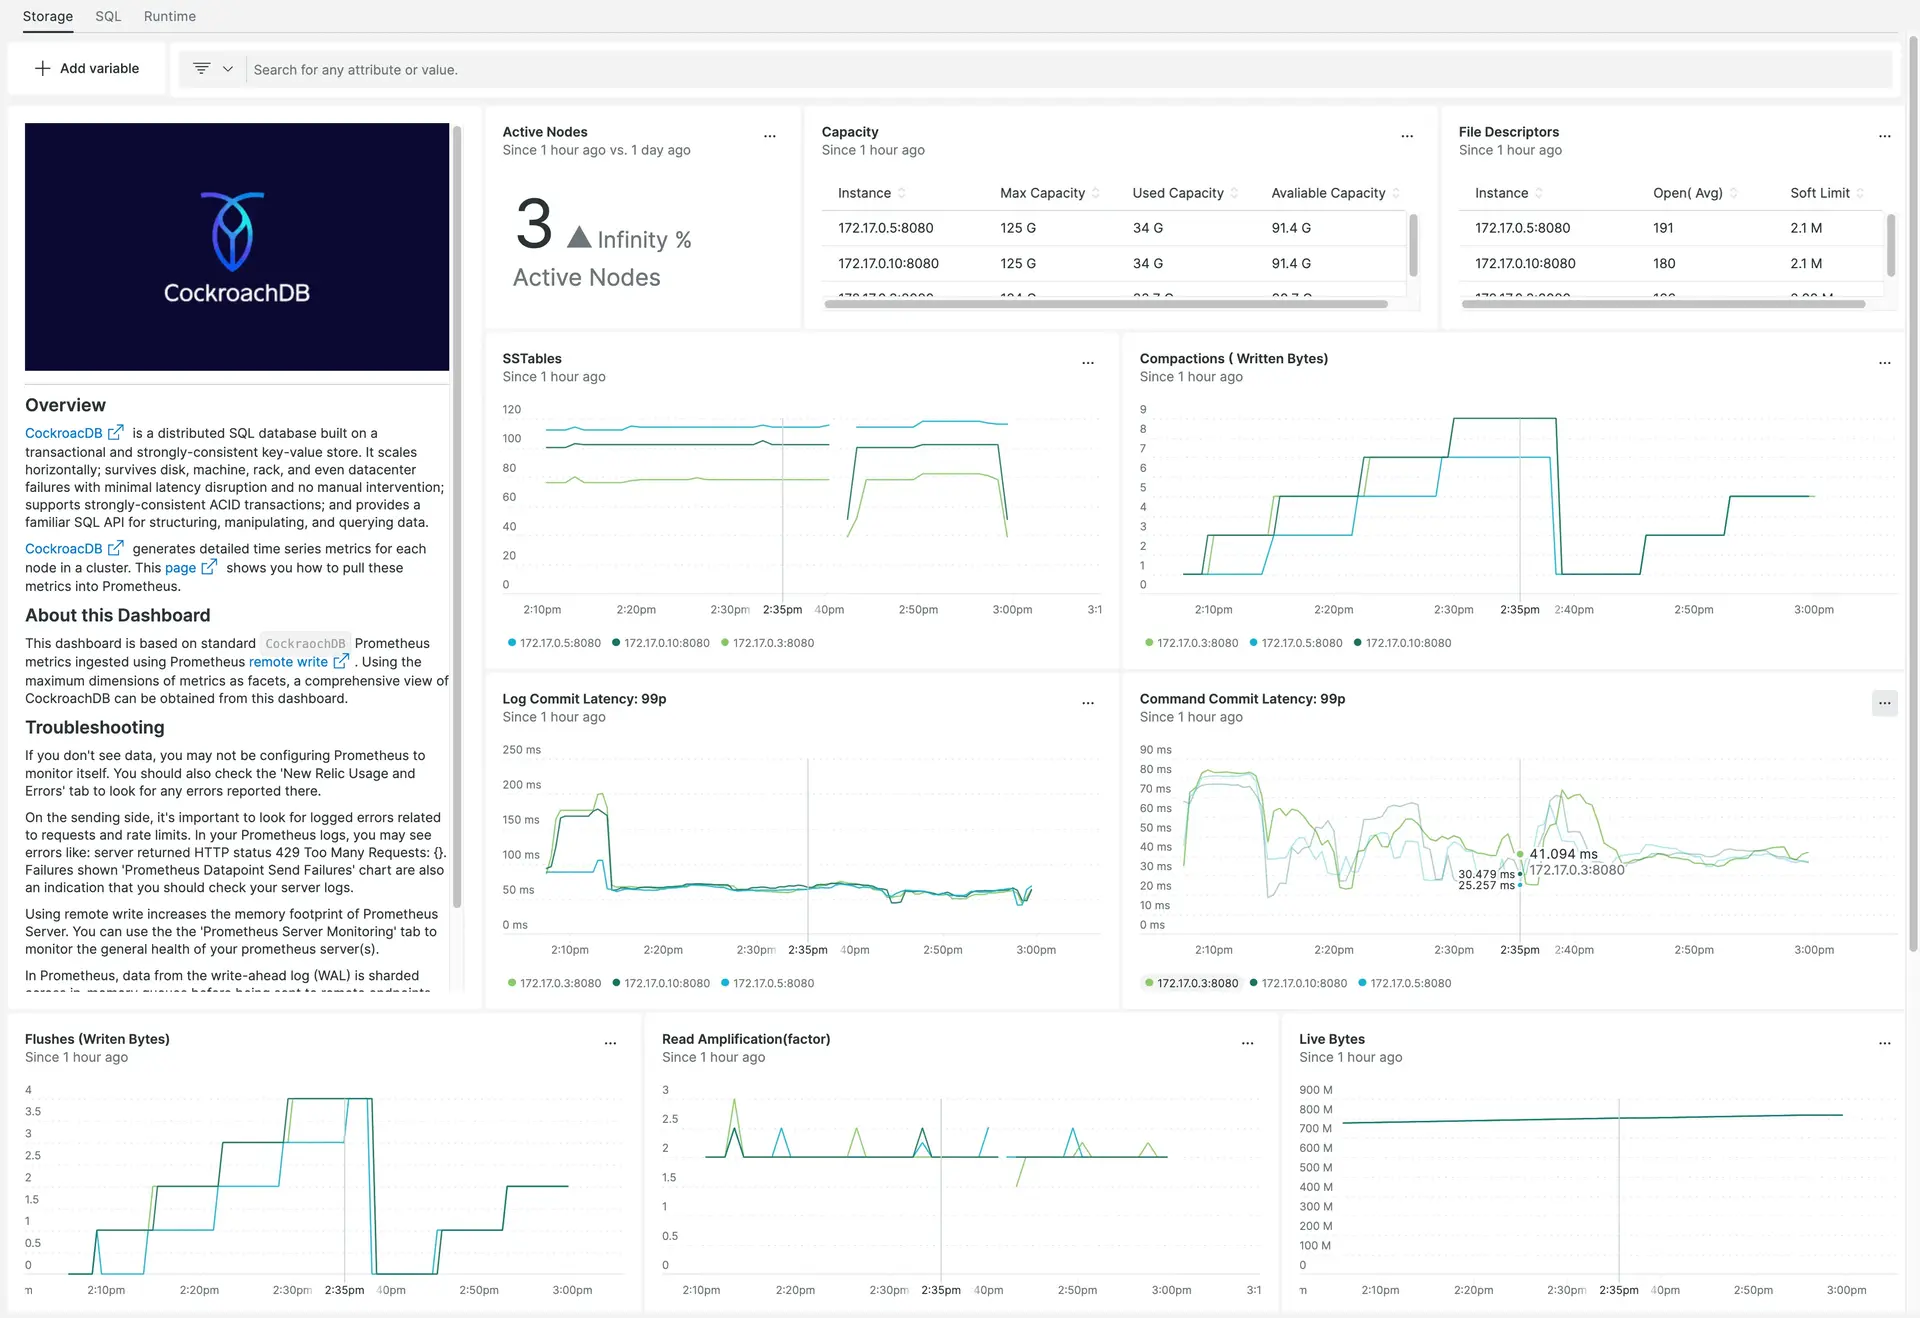
Cockroach Database is a distributed SQL database built on a transactional and strongly-consistent key-value store.
Cockroach Database has these characteristics:
- Scales horizontally
- Survives disk, machine, rack, and even data center failures with minimal latency disruption and no manual intervention
- Supports strongly-consistent ACID transactions
- Provides a familiar SQL API for structuring, manipulating, and querying data
CockroachDB generates detailed time series metrics for each node in a cluster. Monitor CockroachDB with Prometheus shows you how to pull these metrics into Prometheus.
Use New Relic to monitor:
- Cluster health
- Node health
- Store and disk capacity
- SQL queries performance
- High open file descriptor count
- Certificate expirations

Enable the integration
Follow these steps to enable the integration.
Follow the CockroachDB documentation for Prometheus to discover the CockroachDB metrics endpoints.
Set up Prometheus monitoring. Prometheus metrics needs to be integrated with New Relic, you can use the Prometheus Agent or the Remote Write integration, see how to send Prometheus metrics.
Important
The Prometheus Agent only scrapes metrics by default from a set of integrations.
In this case, you must identify your pod or endpoint with one of the these labels
app.kubernetes.io/name,app.newrelic.io/name,k8s-appcontaining the stringcockroachdb.Use the following query to confirm metrics are being ingested as expected:
SELECT * FROM Metric WHERE metricName = 'rocksdb_num_sstables'Install the CockroachDB quickstart to access built-in and alerts.
Important
Some charts of the dashboard include queries with conditions that require the identification of your pod or endpoint with one of the these labels
app.kubernetes.io/name,app.newrelic.io/name,k8s-appcontaining the stringcockroachdb.Once you imported, you can edit or clone the assets to adapt them to your specific requirements.
Remote Write integration
By default, the Prometheus agent default's configuration includes the corresponding rules. When you use the Remote Write integration, it's not possible to infer the type properly because of the CockroachDB metrics naming. In this case, you have to include these rules to override the metric type:
- source_labels: [__name__]separator: ;regex: timeseries_write_(.*)target_label: newrelic_metric_typereplacement: counteraction: replace- source_labels: [__name__]separator: ;regex: sql_byte(.*)target_label: newrelic_metric_typereplacement: counteraction: replace
Find and use the data
Metrics
Prometheus metrics are stored as dimensional metrics. You can query using NRQL or use the Data Explorer to browse the available metrics, facet, and filter by the associated dimensions.
The different sets of metrics exposed by this integration are defined in the CockroachDB documentation.
Use the following NRQL queries to understand the CockroachDB metrics being ingested in New Relic.
Troubleshooting
Follow the troubleshooting tips from CockroachDB documentation to make sure that metrics are configured as expected on your cluster.
You can also check the specific troubleshooting guidelines for Prometheus integrations.