The Python agent supports the Pika RabbitMQ client library, Kafka Python client library, and the Confluent Kafka client library giving you visibility into the performance of your message processing, for both incoming and outgoing messages.
The New Relic UI will show transactions initiated via message receipt (subscribe/consume messages) as Message background tasks. Message creation also appears in transaction traces.
Requirements
Message Queue | Python agent version required |
|---|---|
Pika RabbitMQ | 2.88.0.72 |
Kafka Python | 8.2.0.181 |
Confluent Kafka | 8.2.0.181 |
For more information, see the release notes.
Advertencia
RabbitMQ message tasks are not started for consumers using TornadoConnection.
Advertencia
When consuming messages via Kafka, transactions are reported for each message as it is consumed by the consumer. Transactions will not be reported for bulk consumption operations where multiple messages are consumed at once.
Performance improvements with background tasks
One way to increase responsiveness of web applications is to delegate work to background processes. Message queues are commonly used for this inter-process communication.
In the context of message queuing systems, applications typically interact with message brokers to send and receive messages. In the case of RabbitMQ Pika, this client library allows Python applications to interface with message brokers that implement the Advanced Message Queueing Protocol (AMQP) 0.9 or higher.
The Python agent shows messages sent and received using the client libraries. With this visibility, you can see details including:
- Number of messages produced by your app
- Time your app spends publishing/producing messages
- Time your app spends processing/consuming messages
APM conveniently groups and reports operations that interact with queues. By analyzing this information, you can more easily identify bottlenecks and areas for performance improvement in your message passing architecture.
Supported Metrics
Message Queue | Pika RabbitMQ | Kafka Python | Confluent Kafka |
|---|---|---|---|
Publish a Message | Yes--Referred to as | Yes--Referred to as | Yes--Referred to as |
Receive a Message | Yes--Referred to as | Yes--Referred to as | Yes--Referred to as |
Serialization | No | Yes | Yes |
Deserialization | No | No | Yes |
Heartbeat | No | Yes | No |
View in New Relic UI
Queue operations appear on APM's Transactions page for the selected app.
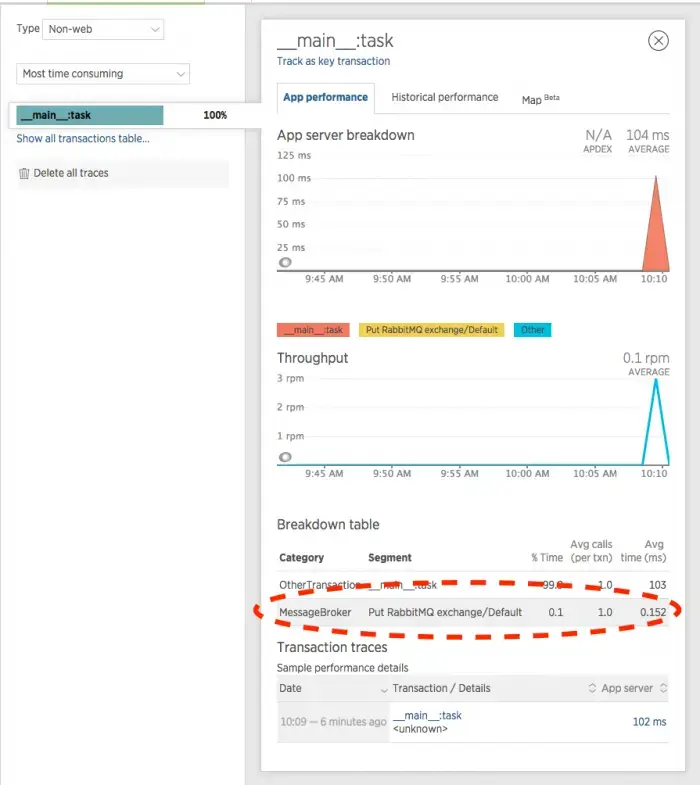
The Put (publish a message) and Take (receive a message) metrics appear in the Breakdown table and are categorized as MessageBroker metrics for RabbitMQ. Here is an example:

one.newrelic.com > All capabilities > APM & services > (select an app) > Monitor > Transactions > (select a transaction): The transaction’s Breakdown table categorizes queue operations as MessageBroker metrics for RabbitMQ and labels them as Put (publish a message) or Take (receive a message).
Transaction traces also provide additional details for messages.
Sugerencia
You can select transaction traces from the app's Summary or Transactions pages in APM.
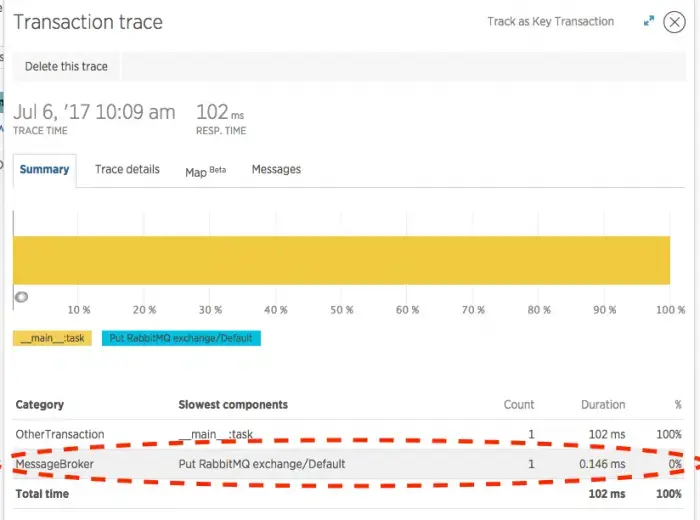
The Transaction trace summary page may show Put and Take operations for RabbitMQ in the Slowest components section. For example:

one.newrelic.com > All capabilities > APM & services > (select an app) > (select a transaction trace): In this example, the selected transaction trace's Summary shows RabbitMQ operations in the colored bar chart. The Slowest components section also lists the RabbitMQ Put and Take results.