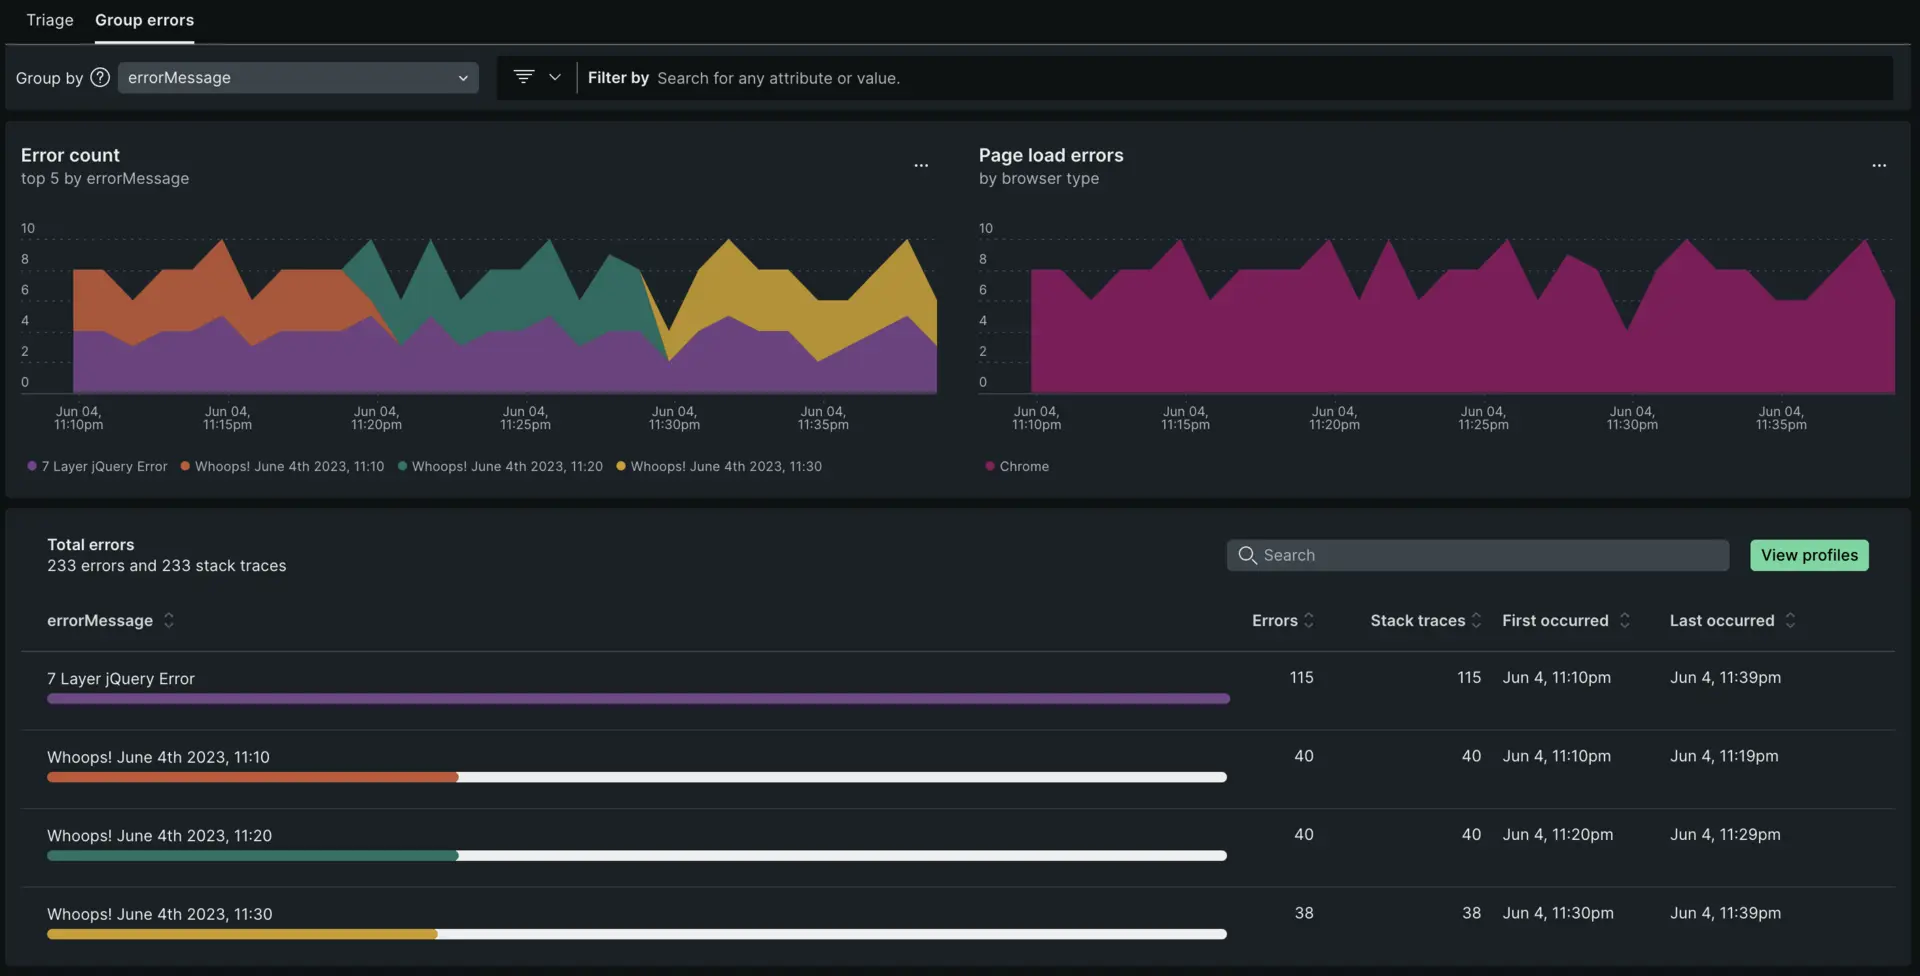
With Group errors tab you can dynamically filter and group errors for deeper analysis. Group errors shows you where your JavaScript errors are happening, and provides tools to help you figure out the root cause. You can also track the scope of errors through Sessions impacted, which automatically shows how many browser sessions are affected by each error group. Additionally, you can query and create dashboards of JS error data in the query builder, or use the browser API to monitor handled errors.
Session impact tracking
For browser applications, New Relic automatically tracks Sessions impacted as a key metric in the Errors inbox. This metric shows the number of unique browser sessions affected by JavaScript errors and helps you understand the scope of issues across your user base.
Key benefits of session impact tracking:
- Automatic collection: No additional configuration required - the metric is collected automatically for all browser entities
- Fallback metric: When user impact data isn't available, New Relic displays sessions impacted to ensure visibility into error scope
- Prioritization: Helps you prioritize error fixes by showing which errors affect the most browser sessions
- Alerting: You can create alerts based on sessions impacted thresholds
You can query sessions impacted using NRQL:
SELECT uniqueCount(newrelic.error.group.sessionImpact) FROM Metric WHERE metricName='newrelic.error.group.sessionImpact'For more details on impact metrics and alerting, see Error scope: Users, sessions, and devices impacted.
To examine JavaScript errors:
- Go to one.newrelic.com > All capabilities > Browser > (select an app) > Errors.
- Use the available options in the UI to examine what may be causing the errors.
- Optional: Review event trail or stack traces in the UI.
- Optional: Query and create dashboards for JS error data with the query builder, or use the API to monitor or log errors.
Errors list view
Start with the page loads errors chart to see at a glance whether there are any unexpected spikes, dips, or patterns with errors in general. Correlate any general patterns on the top 5 errors chart to alerts occurring during the same time period.
- Dynamic grouping: The default grouping for error occurrences is based on the error message. You have the option to change the grouping options by any attribute, up to five attributes at a time.
- Filtering: Many New Relic customers instrument custom attributes. Filtering on a specific custom attribute can be a quick way to cut through the noise of all error occurrences.

Error profiles
Error profiles reveal frequently impacted users during a designated time frame. You can download user attributes as CSV or explore detailed breakdowns by selecting individual rows. Leverage these insights to prioritize bug fixes and improve application stability.
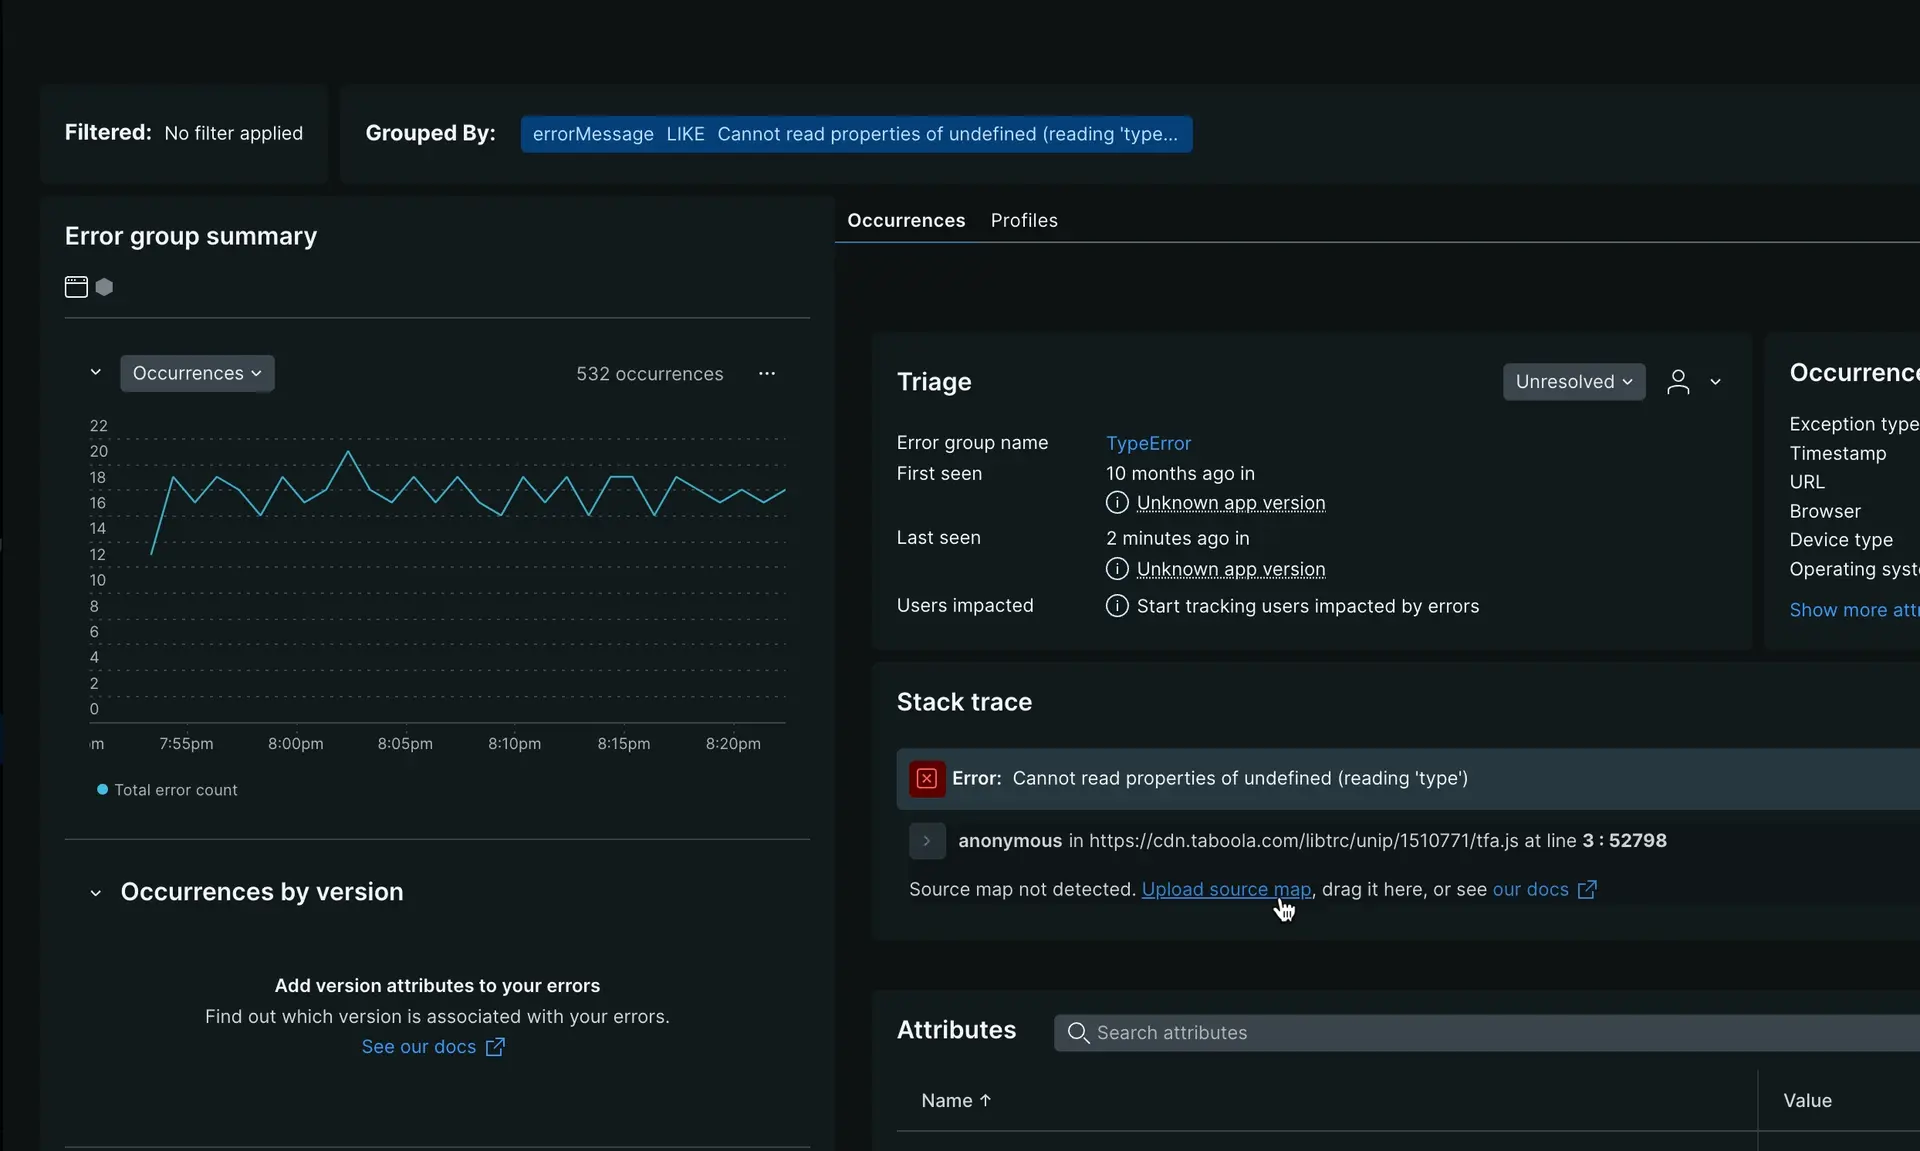
one.newrelic.com > All capabilities > Browser > (select an app) > Errors (errors inbox) > View profiles
Errors details view
On this page, you can dive deep into a specific error group. The detailed view provides in-context details. From the detailed view, you can cycle through specific error occurrences using the toggle in the upper right to navigate between the first instance of the error, the last, or any instance between. At the top of the details page, you can inspect the Filtered and Grouped By fields to see how the information was filtered and grouped. You may receive a permalink of a specific occurrence. It's important to know the filters and group-by selections to understand the context of the occurrence.
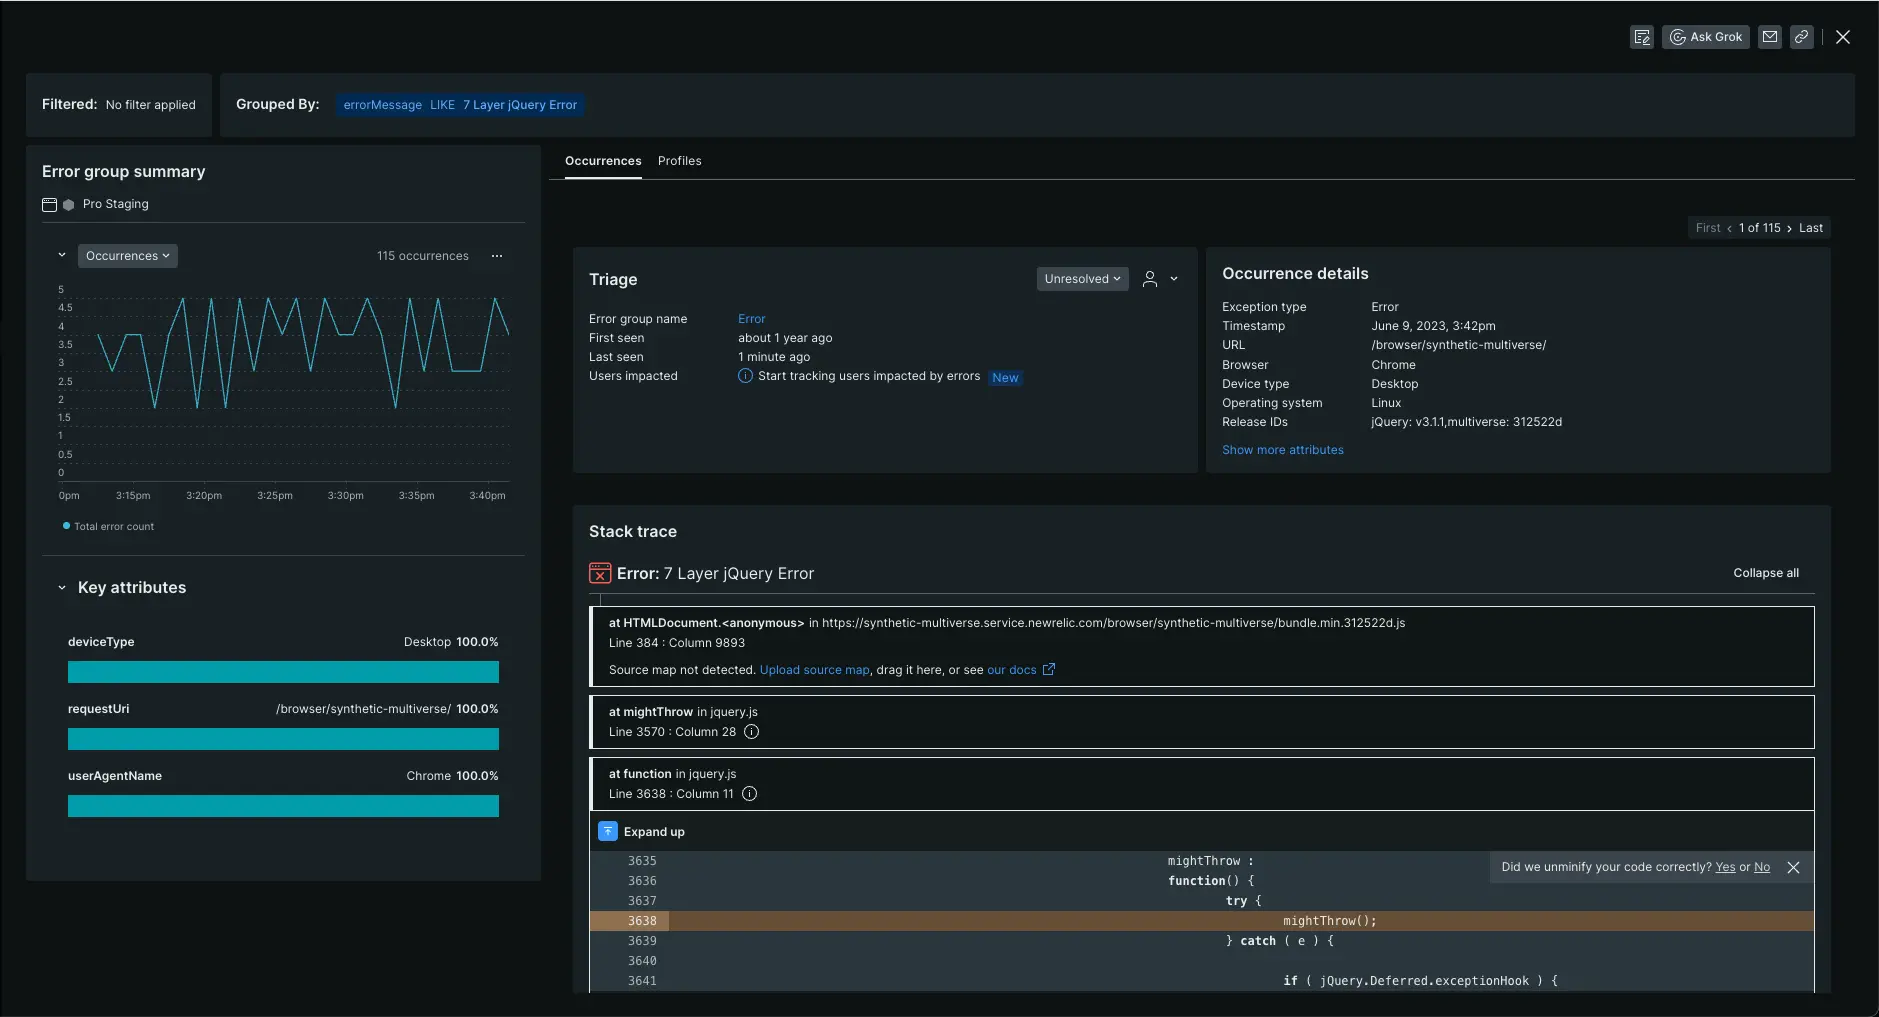
Occurrences tab
The Occurrences tab includes not only error frequency, occurrence details, and stack traces, it also includes triage information.
Triage section
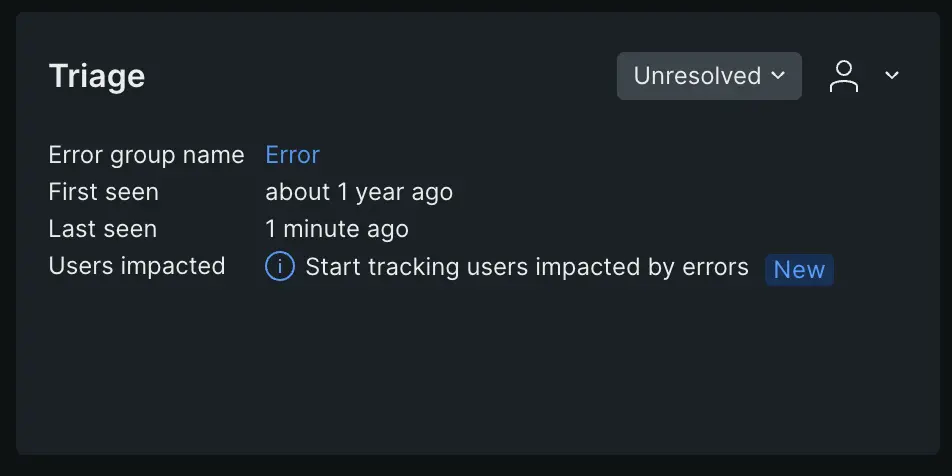
The triage section links the specific error occurrence you're viewing to a system-created error group that has a unique fingerprint. Why does that matter? That unique fingerprint enables you to triage an error group using a status update or assignment. The system-created error groups are the ones you find on the Triage tab. For more info on how they are generated, see How error groups work.
Stack trace
Stack traces can show you where in the code an error is originating from to help for quicker resolution. There are different ways to make sure that the code you're viewing is unminified. You can manually upload source maps via the UI or via the API.
Troubleshoot missing stack traces
Here are some reasons you don't see a stack trace for an error:
If errors are not thrown there won't be a stack trace.
- Example of a thrown error that will NOT have a stack trace: throw
this is an error string. - Example of a thrown error that will have a stack trace: throw new Error
this is an error string.
- Example of a thrown error that will NOT have a stack trace: throw
The Javascript is hosted on a CDN or another external location, and New Relic can't see the errors originating from those scripts. This can be solved in some cases by using cross-origin resource sharing (CORS).
It is an AngularJS error. For more on this, see Missing Angular errors.
The error is a
SyntaxErrororScript error: These occur while the script is loading, so they do not produce a stack trace.Some older browsers may generate errors without a stack trace, or may provide a stack trace that is not usable.
You've captured the error before the New Relic agent sees it.
If the error occurs during multiple harvest cycles in the same user visit, only error events reported during the first harvest cycle will have a stack trace recorded.
Solutions for reporting stack traces
- Use the
noticeErrorAPI call. - Use the JS errors UI page to get more information, including the event trail. The JS errors page is designed to give you actionable information even without a stack trace.
Event trail
For some older browsers, the following errors may be unavailable:SPA monitoring must be enabled. The event trail shows the browser interactions, AJAX calls, and traces that led up to a Javascript error. This can help you troubleshoot the root cause of errors.
For example, if a JS error is occurring after an AJAX request that provides an error message, it could be that your AJAX request doesn't contain the right information. This results in a JS error due to a failed AJAX call.
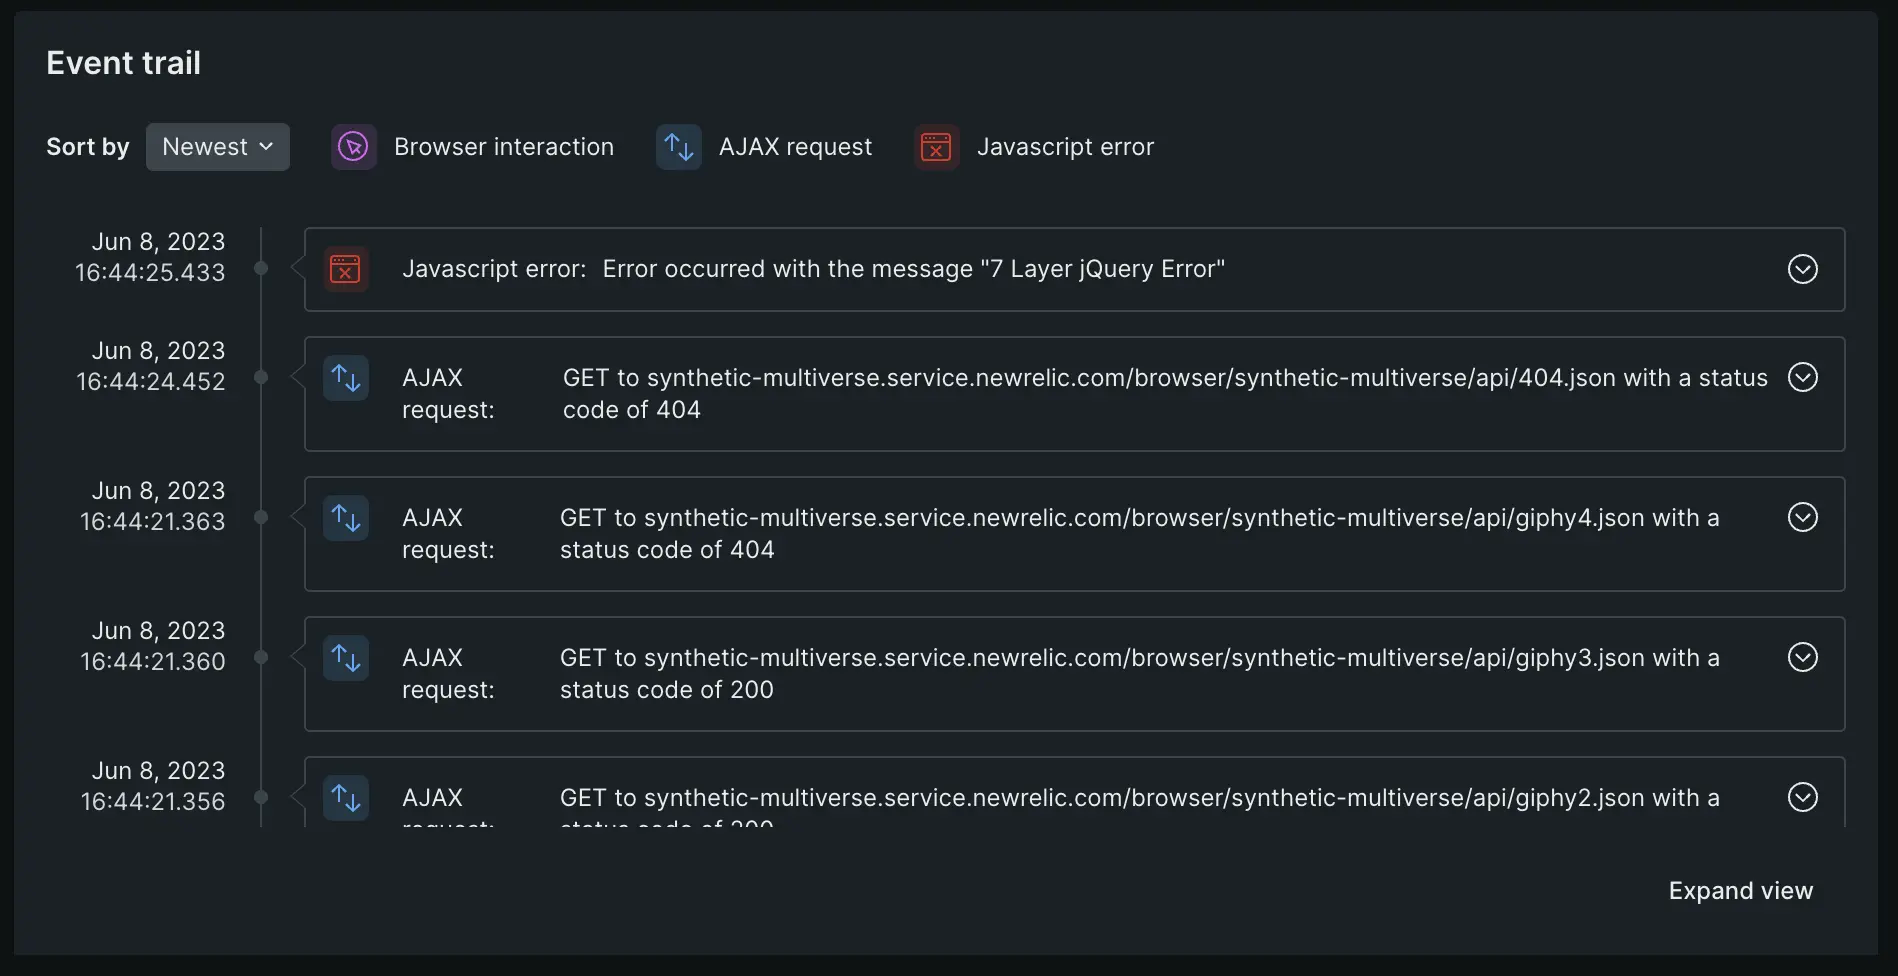
Here are some reasons for events in the event log not being present:
- Agent version. To capture event log data your site must have SPA monitoring enabled (browser agent version 1071 or higher).
- JS error not part of a browser interaction. If the JS error occurs outside of an interaction, the related browser interaction details cannot be captured (for example: if an async JS file experiences an error).
- A click triggered the JS error. In some cases if the error is a direct result of a click, no associated interactions are captured. Without event logs or stack traces, you can use the error detail charts to analyze the impact the error has by browser type, device type, and URI.
Query and visualize JS data
New Relic saves JS errors as event data. This allows you to query your error data in the query builder. To run NRQL queries and create dashboards to view or share, query the JavaScriptError event type in the query builder.
Global and generic errors
New Relic wraps JavaScript functions to get information about thrown errors via the stack trace. If errors aren't thrown, they won't be available. For example, if you have an AngularJS application, follow the troubleshooting procedures when AngularJS errors do not appear in the UI. For some older browsers, the following errors may be unavailable:
SyntaxErrororScript error: These occur while the script is loading, so they do not produce a stack trace.- In-line JavaScript or event handler errors: These are unwrapped.
- Errors thrown from third-party scripts that reside on another domain are not available.
- Errors occurring on older browsers: These may not be able to provide a usable stack trace. In some cases, they may not provide a stack trace at all. Error collection is done by wrapping JavaScript functions, so errors thrown by the browser at a lower level (such as cross-origin resource sharing errors) also are not available.