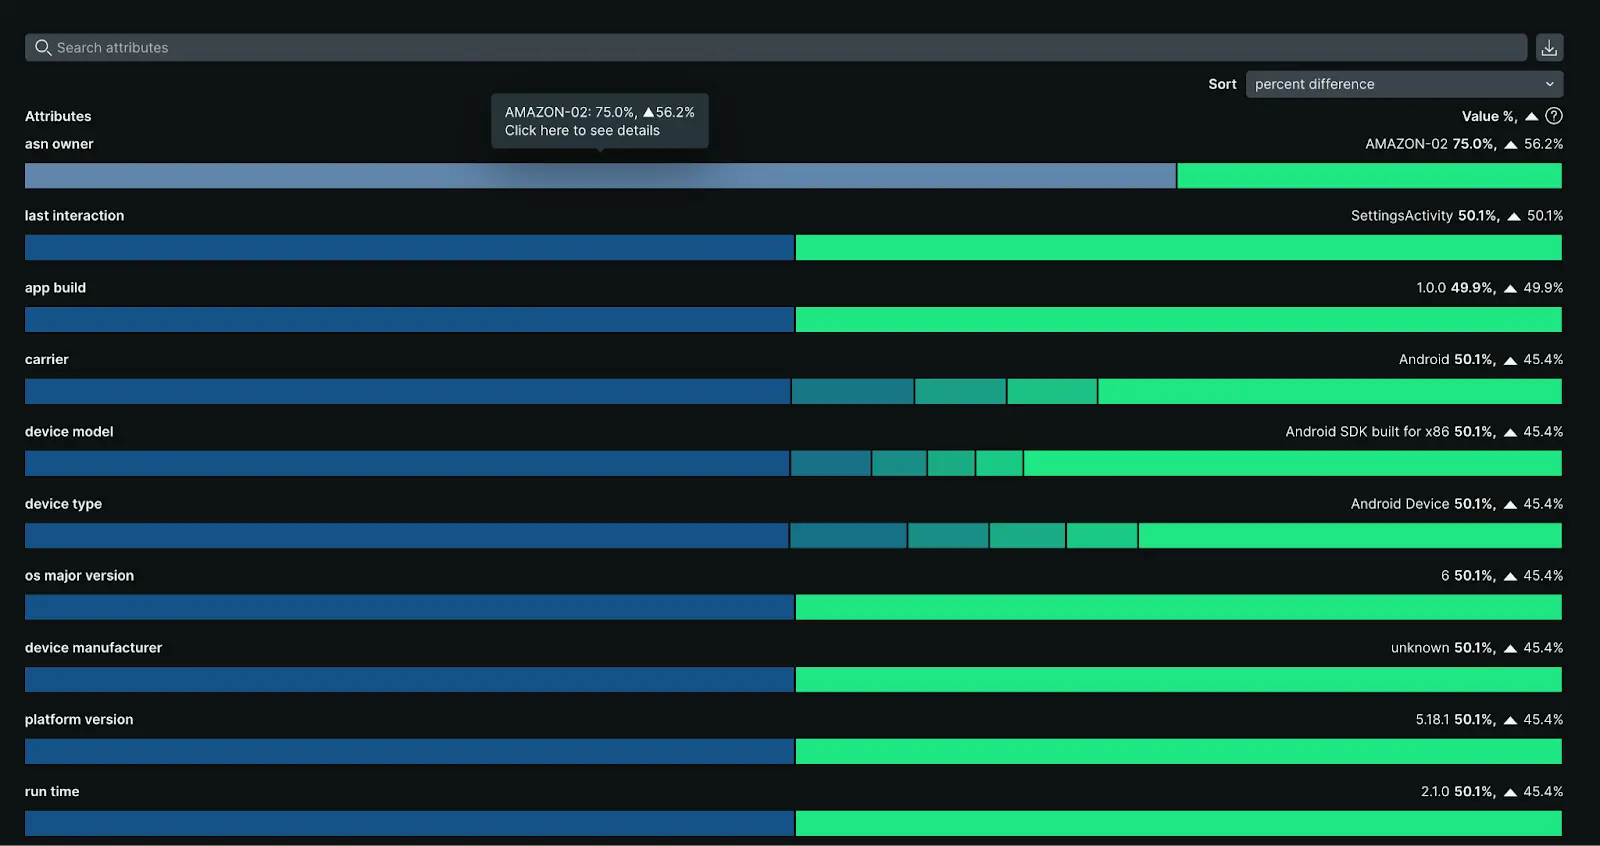
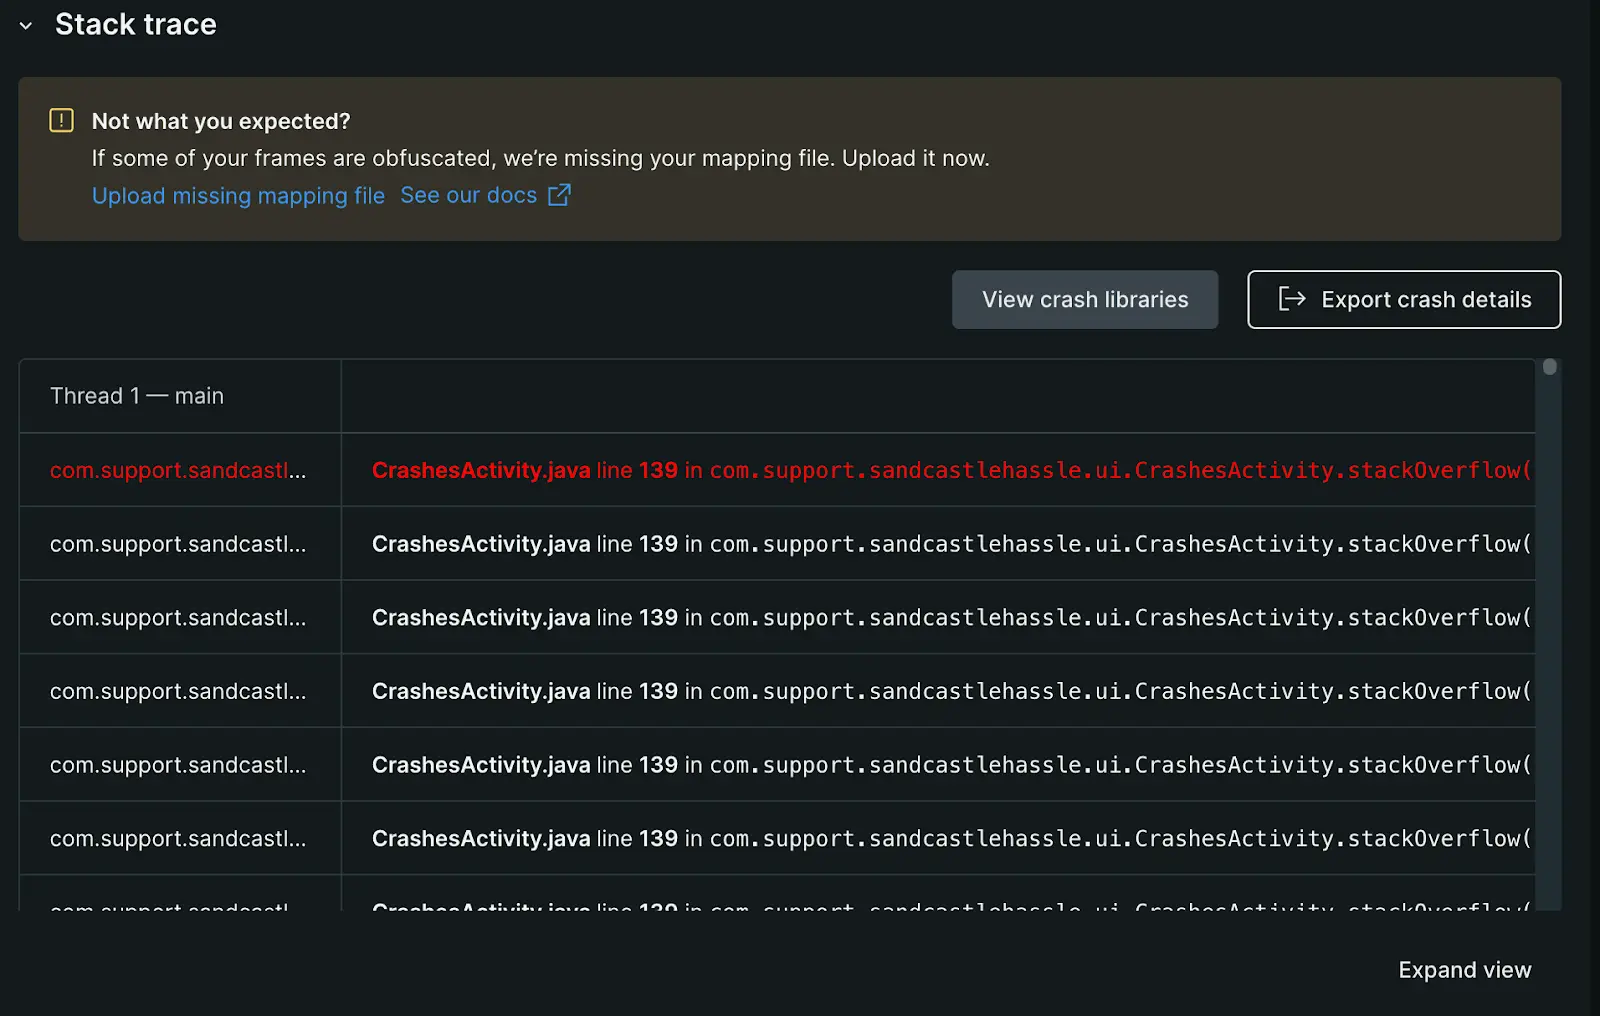
Frequent mobile app crashes degrade the user experience and cause delays in the development lifecycle. The Group crashes page is designed to help your development team deliver a more stable and reliable mobile app experience to your users.
With the Group crashes page you can:
- Assess overall crash trends: Review the Crash rate percentage and Crash-free users percentage charts to quickly identify any anomalies or patterns in crash occurrences.
- Filter for deeper analysis: Utilize groups and filters to focus on specific crash attributes, such as device type, location, or custom data points.
- Identify patterns: Examine the Crash location table for trends related to location, exception type, date, frequency, app version, and the number of affected users or devices.
- Monitor device impact: Track how many unique devices are affected by crashes through the Devices impacted metric, which is automatically collected for mobile applications.
- Investigate individual crashes: Select a crash report to view its interaction trail, event trail, thread details, attributes, and other relevant information. You can also resymbolicate or export the details to Xcode for debugging.
- Update crash status: Mark the crash as
Resolvedor choose from other status options, such asResolved in specific version.
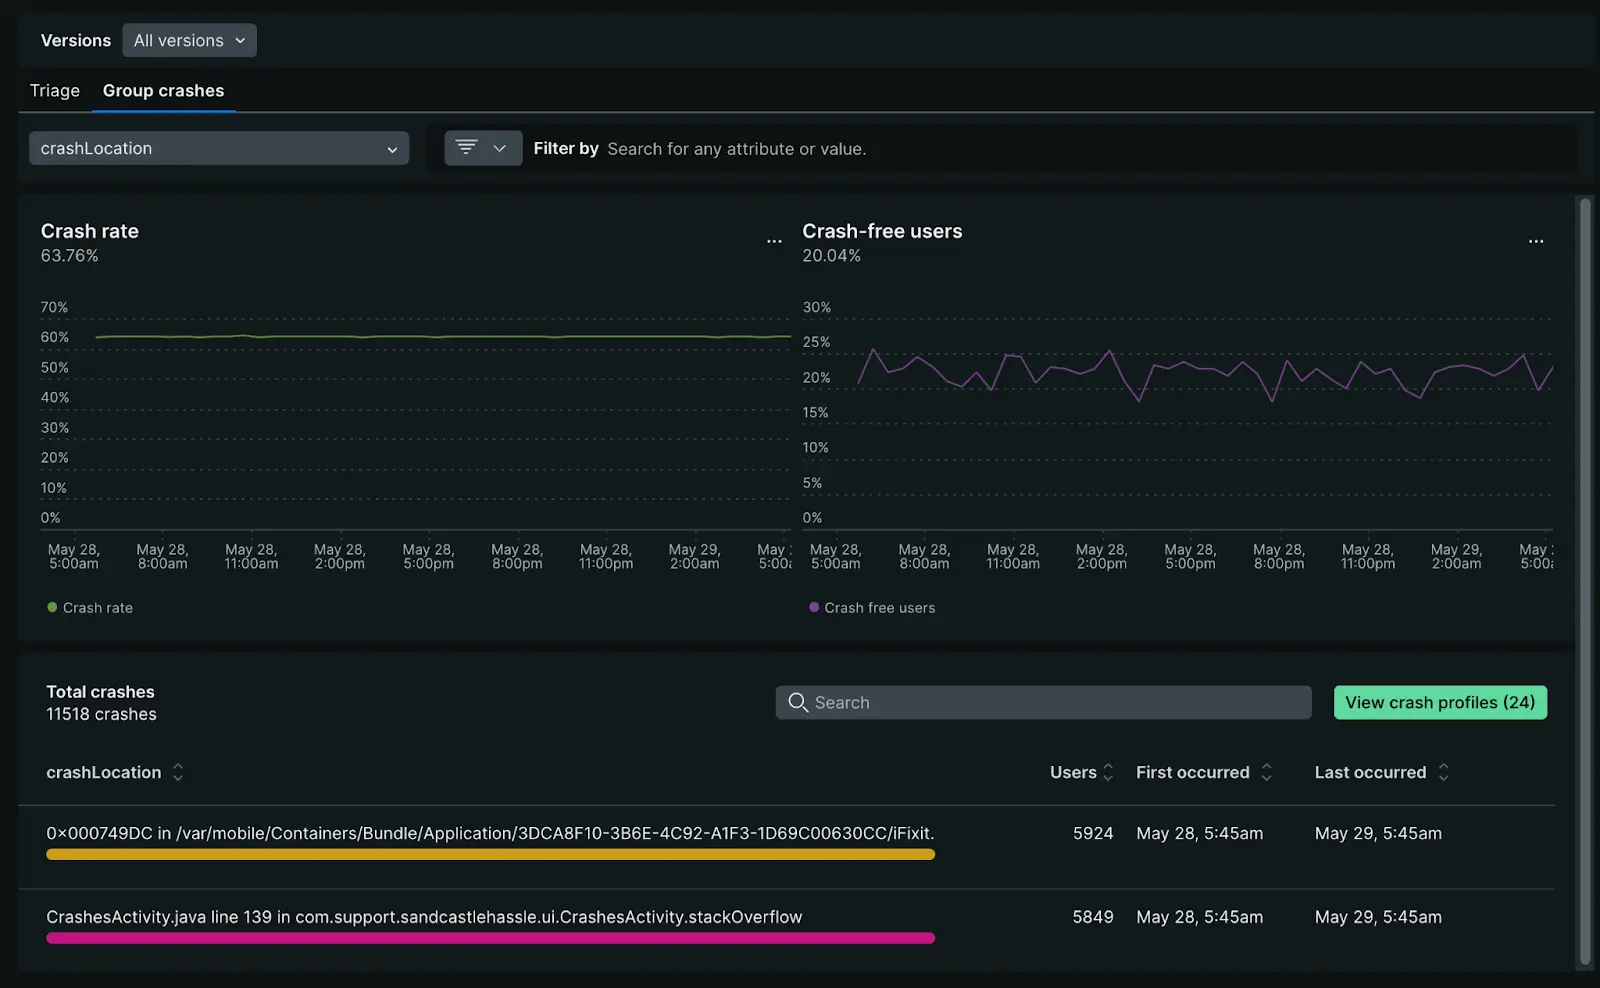
one.newrelic.com > All capabilities > Mobile > Crashes (errors inbox): With our Group crashes tab you can analyze crash rate and crash free users at a glance or dive deeper into specific crash locations.
Device impact tracking
For mobile applications, New Relic automatically tracks Devices impacted as a key metric in the Errors inbox. This metric shows the number of unique mobile devices affected by crashes and helps you understand the scope of issues across your user base.
Key benefits of device impact tracking:
- Automatic collection: No additional configuration required - the metric is collected automatically for all mobile entities
- Fallback metric: When user impact data isn't available, New Relic displays devices impacted to ensure visibility into error scope
- Prioritization: Helps you prioritize crash fixes by showing which errors affect the most devices
- Alerting: You can create alerts based on devices impacted thresholds
You can query devices impacted using NRQL:
SELECT uniqueCount(newrelic.error.group.deviceImpact) FROM Metric WHERE metricName='newrelic.error.group.deviceImpact'For more details on impact metrics and alerting, see Error scope: Users, sessions, and devices impacted.
Suggested workflow
These steps outline our recommended approach to crash investigation, enabling you to gain a complete understanding of the alert event, identify contributing factors, and implement effective debugging strategies.
Crashes details view
The Crash summary panel includes:
- Occurrences chart: Visualizes the frequency of this specific crash over the selected period since its initial detection. If multiple occurrences are recorded, you can navigate through each instance.
- Crash type breakdown : Displays the distribution of this crash across different operating system versions or affected devices.
Resolved crashes are indicated by a banner that shows the user who resolved the crash and the resolution timestamp. Note that mobile monitoring's data retention policies apply, allowing you to filter by resolved crashes for historical analysis when needed.
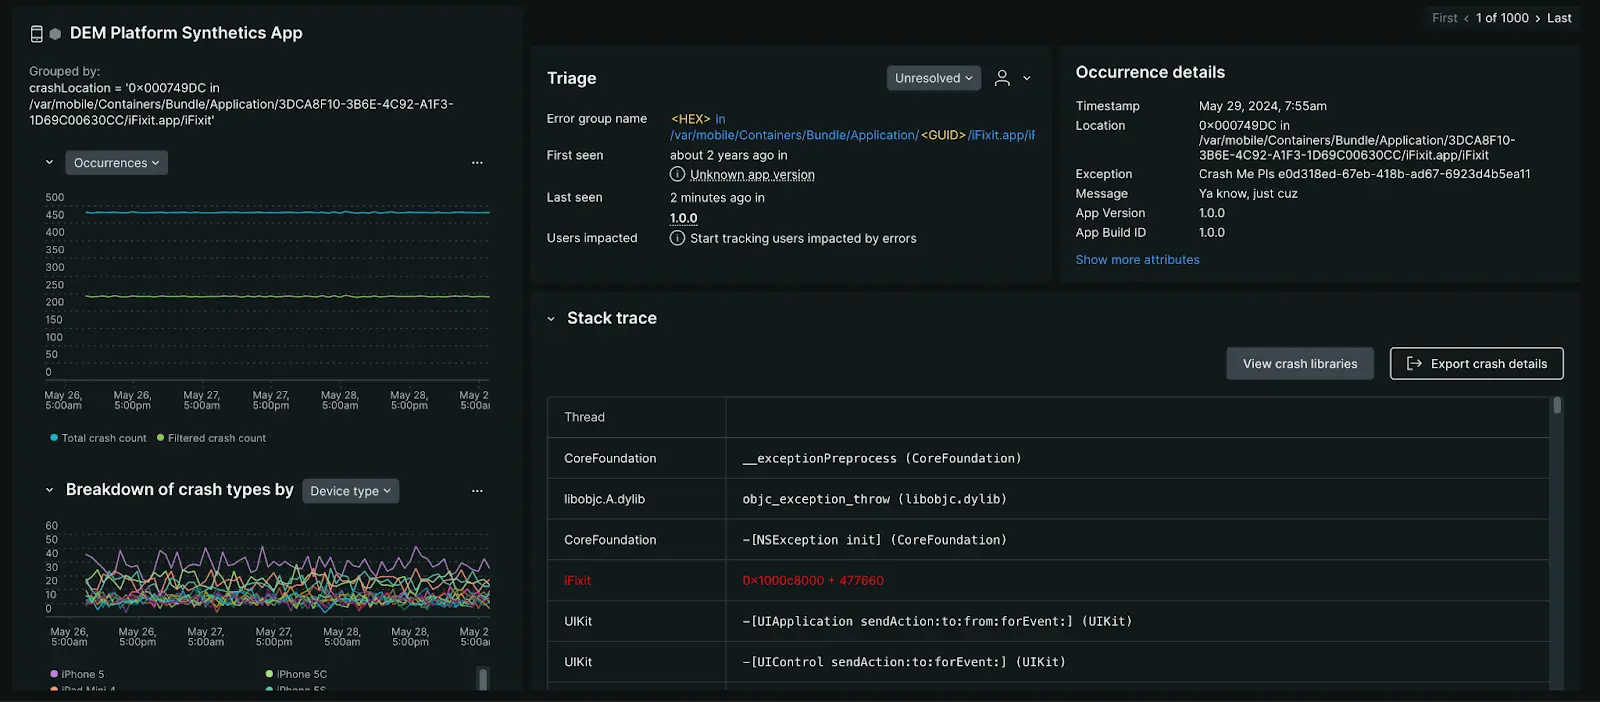
one.newrelic.com > All capabilities > Mobile > Crashes (errors inbox): Select a crash location to open the Crash details page.
Triage your crashes
The triage section associates the specific error occurrence you're viewing with its system-created error group. These system-created error groups are identified by a unique fingerprint. It is this unique fingerprint that allows you to triage error groups by status updates or assignments.
For more info on how error groups are created, see How error groups work, and to learn more about status and assignments, see Error tracking.

one.newrelic.com > All capabilities > Mobile > Crashes (errors inbox) > Select a crash location : From the Crash details page you can triage specific error occurrences by adding status updates or assignments.
Crash attributes
Each crash sample provides detailed information about the device environment where the crash occurred, including:
- App version: The specific version of the application in which the crash occurred.
- Device type: The model of the device on which the crash occurred.
- OS version: The operating system version running on the device.
- RAM used: The amount of memory the application was utilizing at the time of the crash.
- Disk free: The amount of available storage space on the device when the crash happened.
- Attributes: Detailed attributes associated with the crash report, offering deeper insights into the context of the crash.
You can export crash details to Xcode or resymbolicate your source code, if applicable, to streamline the troubleshooting process.
Event trail
The event trail provides a chronological log of all mobile events leading up to a crash, aiding root cause analysis. These can be events New Relic monitors by default, or custom events. The event trail is sorted chronologically, beginning with the oldest event, which is typically the app launch, but you can modify the following:
- Sort: Toggle between ascending and descending order.
- Event filtering: Filter by event type, like
interaction,request, orrequest error. - Event details: Expand individual events to inspect their attributes, like
responseTime,orrequestUrlfor request events.
After you've sorted and filtered your events, you can dig a little deeper into the events that lead up to the crash by examining:
- Custom breadcrumbs: Utilize the Record breadcrumb SDK to create custom
MobileBreadcrumbevents. This allows you to log specific application interactions that may be relevant to crash analysis. - Handled exceptions: Use the
recordHandledExceptionSDK methods for iOS and Android to annotate where exceptions are handled in your application. These annotations will automatically populate the crash event trail.
For detailed guidance on enhancing crash event trails with custom data, see Record breadcrumbs.
To fully leverage our crash analysis tools, make sure to:
- Use the mobile SDK to create custom
MobileBreadcrumborMobileHandledExceptionevents. - Enable
MobileRequestevents for capturing network request data.
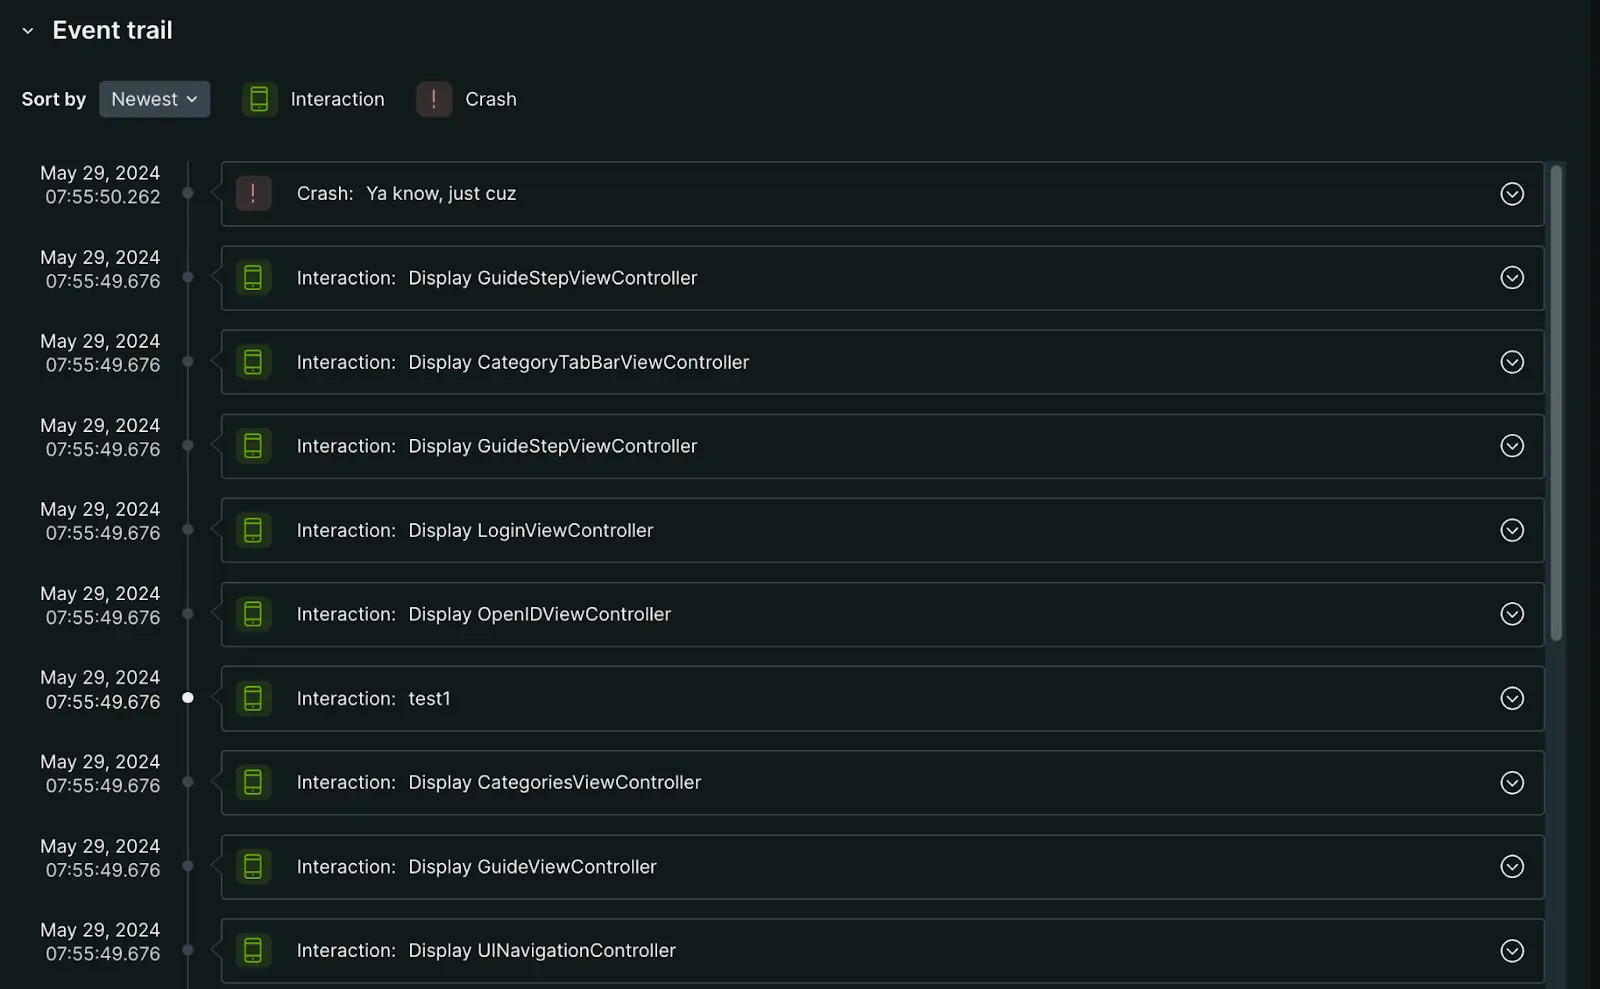
one.newrelic.com > All capabilities > Mobile > Crashes (errors inbox) > Select a crash location : Dig deeper into the events that led up to a specific crash using our event trail.
Mobile stack trace
The stack trace for each crash is displayed beneath the crash details. Each frame within the stack shows the associated library or package name, and method. For each crash, the mobile agent attempts to detect the specific stack frame containing the programming error responsible for the crash. If successfully detected, that stack frame appears red.
- iOS apps: Source code method names and line numbers are visible if you have uploaded the corresponding dSYM files for each build.
- Android apps using ProGuard: Package and method names will be de-obfuscated if ProGuard map uploading is enabled.
- Android native crash reports: These reports will only display source filenames and relative code offsets.
You can use email alerts to promptly respond to new crashes.
Android-native crash reporting
New Relic Android agent version 6.7.0, introduced enhancements to help track and diagnose native crashes, reporting, and analysis. These enhancements include signal violations and other faults that occur at the native code level during runtime.
These enhancements include:
Native crash reports: Signal violations and other crashes reported by the app during runtime, including:
- Signal 4: Illegal instruction
- Signal 6: Abnormal termination
- Signal 7: Bus error/bad memory access
- Signal 8: Floating-point exception
- Signal 1: Segmentation violation/invalid memory reference
Native runtime exceptions: The native agent will report any unhandled C++ exceptions thrown by the app during runtime, and report them as handled exceptions. Unhandled exceptions are usually fatal and will crash the application.
Importante
Native crash reporting is an incubating feature. Native crash monitoring is difficult at best, but the agent will make all best-attempts to detect and report these conditions. It may miss or incompletely report some conditions, and there may be latency viewing these conditions in the application dashboard.
Symbolication of native symbols will not be supported in early NDK agent releases. When native symbols for an app are not present, the stack trace produced by a crash consists only of these obfuscated labels, which are not easily readable.
You can view detailed information about native crashes in New Relic Mobile's Crash analysis UI, or receive crash notifications by email. You can also explore the crash data deeper with New Relic Insights, or integrate with ticketing systems for further investigation.
Troubleshooting
Keep in mind that profiles are disabled when there are no statistically significant differences between attributes values of crashed and crash-free sessions or there are no profiles available that match the applied filters.
