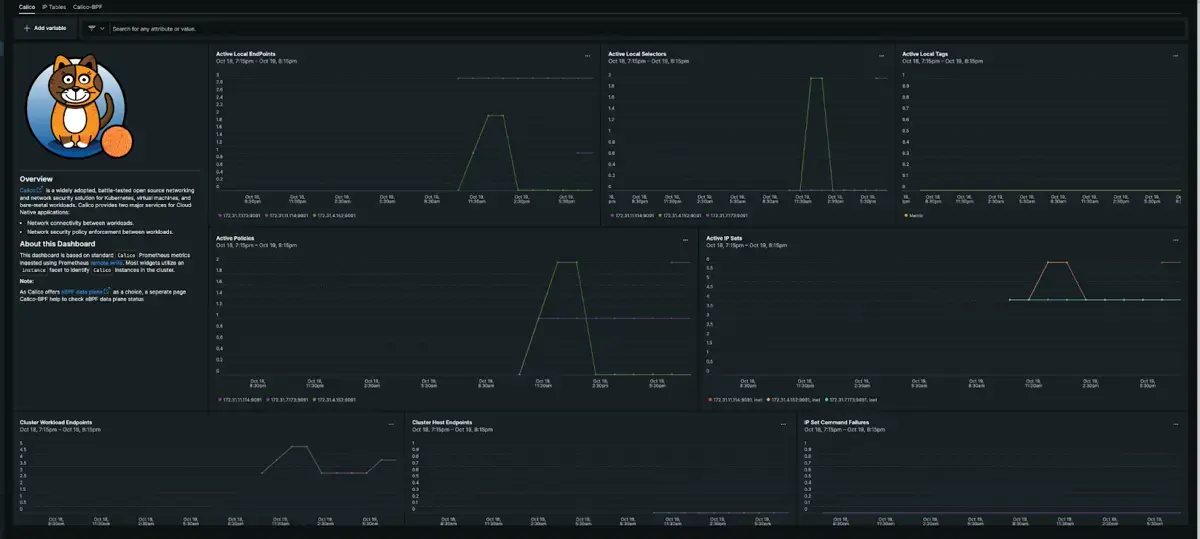
Calico CNI is a widely adopted, battle-tested open source networking, and network security solution for Kubernetes, virtual machines, and bare-metal workloads. Calico provides two major services for Cloud Native applications:
- Network connectivity between workloads.
- Network security policy enforcement between workloads.
Use New Relic to view a dashboard based on Prometheus metrics which helps you understand the Calico CNI of your k8s cluster. With New Relic you can monitor:
- Active network policies by instances
- Active IP tables rules by instances and chain type (filter, mangle, nat, and raw)
- IP tables save and restore errors
- BPF specific metrics if BPF is used as a dataplane for Calico

Enable the integration
Follow these steps to enable the integration.
Follow the Calico documentation for Prometheus to discover the Calico metrics endpoints.
Set up Prometheus monitoring. Prometheus metrics needs to be integrated with New Relic, you can use the Prometheus Agent or the Remote Write integration, see how to send Prometheus metrics.
Importante
The Prometheus Agent only scrapes metrics by default from a set of integrations.
In this case, you must identify your pod or endpoint with one of the these labels
app.kubernetes.io/name,app.newrelic.io/name,k8s-appcontaining the stringcalico.Use the following query to confirm metrics are being ingested as expected:
FROM Metric SELECT count(*) WHERE metricName LIKE 'felix_%' FACET metricName LIMIT MAXInstall the Calico quickstart to access built-in dashboards and and alerts.
Once you imported, you can edit or clone the assets to adapt them to your specific requirements.
Importante
Some charts of the dashboard include queries with conditions that require the identification of your pod or endpoint with one of the these labels
app.kubernetes.io/name,app.newrelic.io/name,k8s-appcontaining the stringcalico.
Find and use the data
Metrics
Prometheus metrics are stored as dimensional metrics. You can query using NRQL or use the Data Explorer to browse the available metrics, facet, and filter by the associated dimensions.
The different sets of metrics exposed by this integration are defined in the Calico documentation.
Use the following NRQL queries to understand the metrics being ingested in New Relic:
List unique metric names:
FROM Metric SELECT uniques(metricName) WHERE metricName LIKE 'felix_%' LIMIT MAXCount number of metric updates:
FROM Metric SELECT datapointcount() WHERE metricName LIKE 'felix_%' LIMIT MAXEstimate data ingestion (daily ingest, in bytes):
FROM Metric SELECT bytecountestimate() WHERE metricName LIKE 'felix_%'SINCE 1 day ago
Troubleshooting
Use this command to verify that he Calico Prometheus endpoint is emitting metrics on any K8s node configured with Calico CNI:
bash$curl <Calico-Pod-IP>:9091/metricsFollow the troubleshooting tips from Calico documentation to make sure that metrics are configured as expected on your cluster.
You can also check the specific troubleshooting guidelines for Prometheus integrations.