Redis is an open source, in-memory data store used by developers as a database, cache, streaming engine, and message broker.
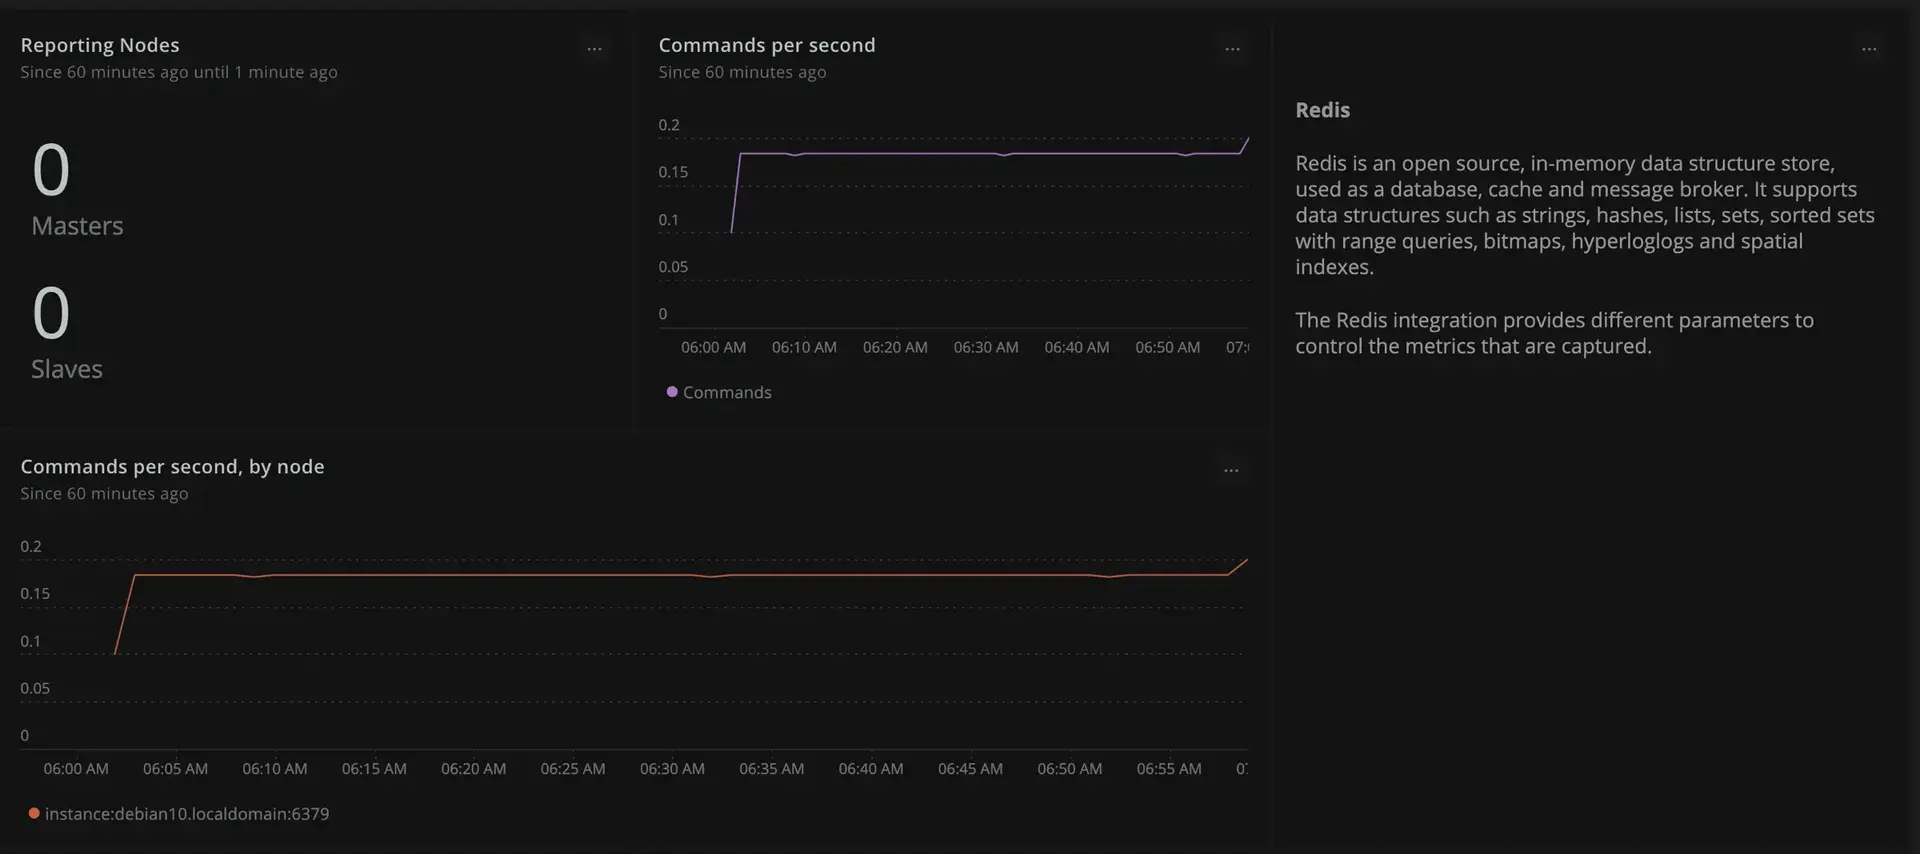
New Relic provides crucial tools for monitoring your Redis instances using the Prometheus Remote-Write integration. It supports features such as a visual dashboard complete with charts detailing all critical performance and health metrics relevant to your Redis system.
With New Relic you can monitor:
- Controller, repo server, and argo server statistics
- Overview snapshot (#masters, #slaves) + charts with commands/sec, and commands/sec by node
- Charts showing connected clients, connected clients by node, changes since last save by node, expired keys/second by node, memory used by node, and blocked clients
- Charts showing keyspace hit ratio by node, evicted keys/second by node, input bytes/second by node, network I/O per second, and output bytes / second by node

Enable the integration
Follow these steps to enable the integration.
Follow the Redis exporter documentation to add the required pod annotations for Prometheus to discover the metrics endpoints.
Set up Prometheus monitoring. Prometheus metrics needs to be integrated with New Relic, you can use the Prometheus Agent or the Remote Write integration, see how to send Prometheus metrics.
Importante
The Prometheus Agent only scrapes metrics by default from a set of integrations.
In this case, you must identify your pod or endpoint with one of the these labels
app.kubernetes.io/name,app.newrelic.io/name,k8s-appcontaining the stringredis.Use the following query to confirm metrics are being ingested as expected:
FROM Metric SELECT count(*) WHERE metricName LIKE 'redis_%' FACET metricName LIMIT MAXInstall the Redis (Prometheus) quickstart to access built-in and alerts.
Once you imported, you can edit or clone the assets to adapt them to your specific requirements.
Importante
Some charts of the dashboard include queries with conditions that require the identification of your pod or endpoint with one of the these labels
app.kubernetes.io/name,app.newrelic.io/name,k8s-appcontaining the stringredis.
Find and use the data
Metrics
Prometheus metrics are stored as dimensional metrics. You can query using NRQL or use the Data Explorer to browse the available metrics, facet, and filter by the associated dimensions.
The different sets of metrics exposed by this integration are defined in the Redis exporter documentation.
Use the following NRQL queries to understand the metrics being ingested in New Relic:
List unique metric names:
FROM Metric SELECT uniques(metricName) WHERE metricName LIKE 'redis_%' LIMIT MAXCount number of metric updates:
FROM Metric SELECT datapointcount() WHERE metricName LIKE 'redis_%' FACET metricNameEstimate data ingestion (daily ingest, in bytes):
FROM Metric SELECT bytecountestimate() WHERE metricName LIKE 'redis_%' SINCE 1 day ago
Entities
This integration enables Redis entities powering the full set of entity capabilities such as golden metrics, entity dashboards, workloads, and lookout.
Troubleshooting
Follow the troubleshooting tips from Redis exporter documentation to make sure that metrics are configured as expected on your cluster.
You can also check the specific troubleshooting guidelines for Prometheus integrations.