When you install Pixie using New Relic guided install, the New Relic plugin for Pixie is automatically enabled and your auto-telemetry data is stored in two locations.
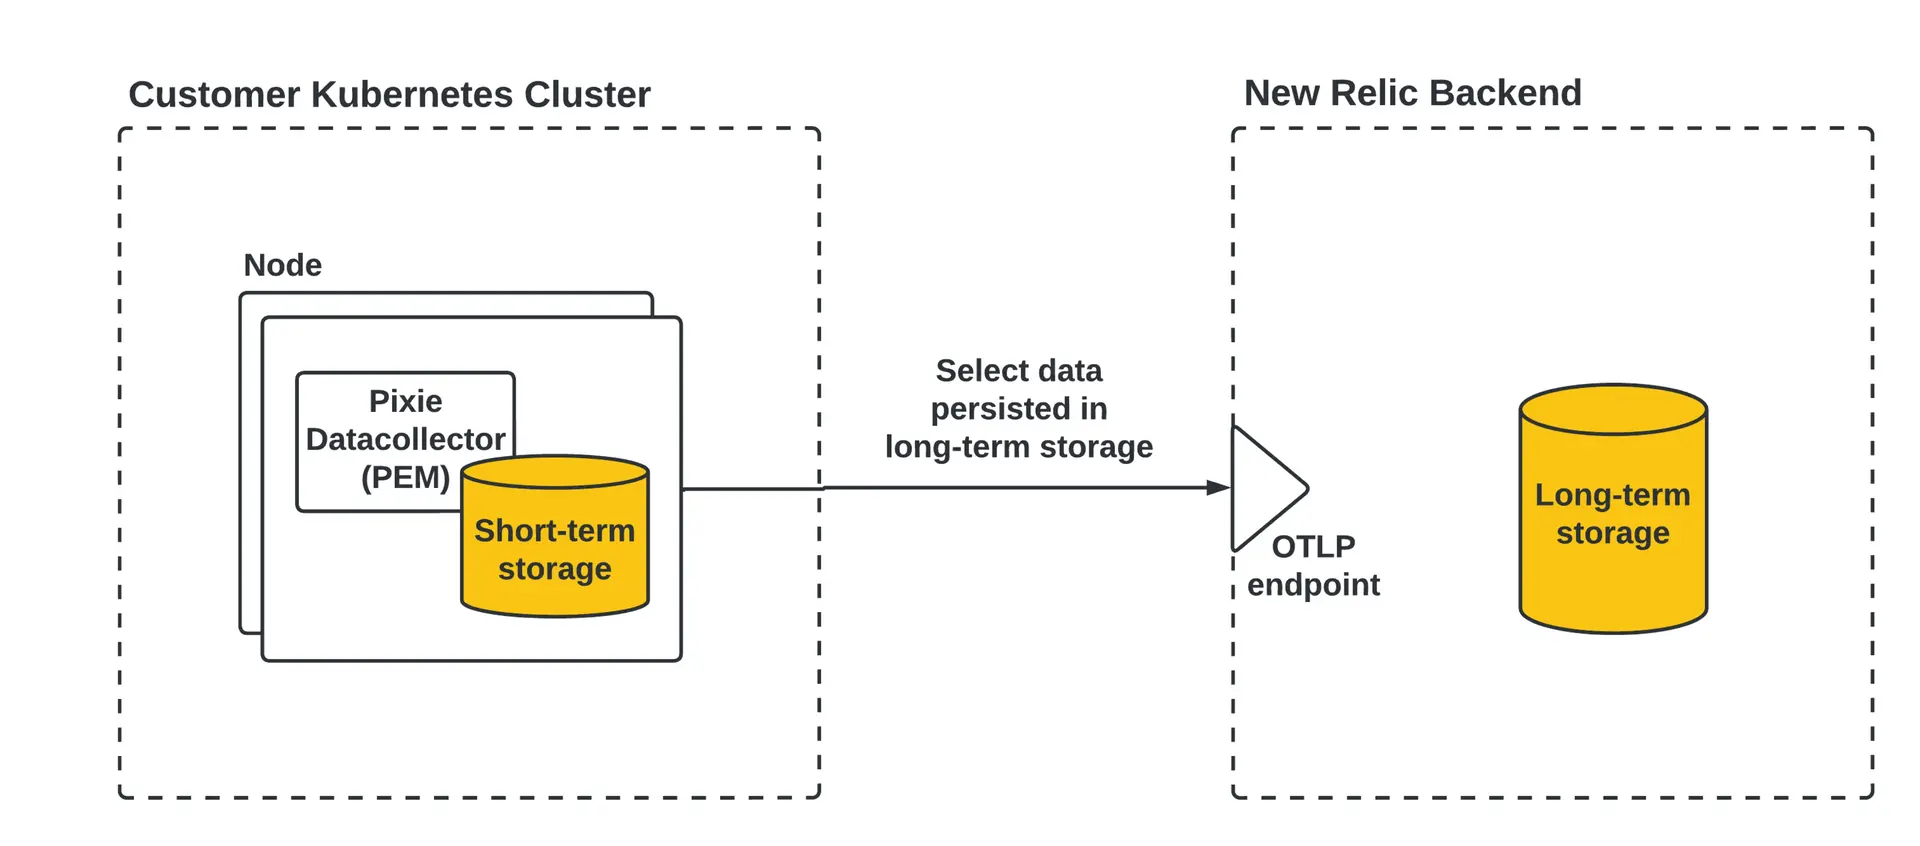
- Pixie stores the full set of telemetry data it collects on the nodes in your cluster in short-term storage (less than 24 hours).
- The New Relic plugin for Pixie auto-registers the cluster with the Pixie plugin system and persists select telemetry data in New Relic for long-term storage.

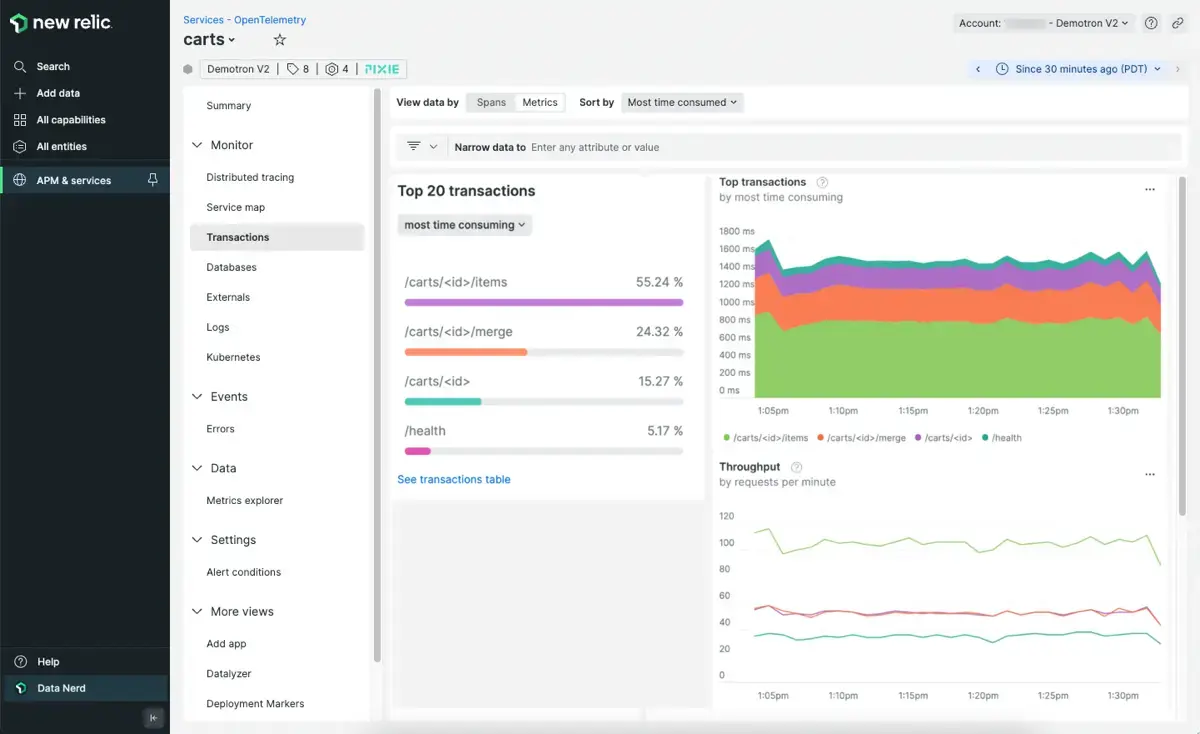
Pixie auto-telemetry seen in the New Relic UI.
This hybrid storage model allows you to debug your active Kubernetes incidents with a rich set of the most recent telemetry data, while only paying to ingest a select and configurable amount of data into long-term storage.

The New Relic Pixie integration hybrid storage model. You can interact with both sets of Pixie data directly from the New Relic UI.
Where can I see Pixie data in the New Relic UI?
In the New Relic UI, you can interact with the Pixie telemetry data in both short-term and long-term storage:
- Query the full set of Pixie telemetry data in short-term storage on your cluster using the Live Debugging with Pixie tab.
- Explore Pixie data persisted in New Relic using the Kubernetes cluster explorer.
- Inspect full-body application request and responses persisted in New Relic.
- Create dashboards of Pixie data persisted in New Relic.
- Query Pixie data persisted in New Relic using the query builder and NerdGraph API.
What data does Pixie collect?
Pixie uses eBPF to automatically collect telemetry data such as full-body application requests, resource and network metrics, application CPU profiles and more.
To see the complete list of data sources that Pixie automatically collects, check out Pixie's reference docs.
How much data does Pixie store?
The primary focus of the open source Pixie project is to build a real-time debugging platform. Short-term storage on the cluster is limited, so Pixie telemetry data is stored for up to 24 hours (at most) before it is aged out of memory. Since this data is stored in your cluster, you don't pay for ingesting it.
To learn how to increase or decrease Pixie's short-term storage, see the Manage Pixie memory guide.
What Pixie data does New Relic persist?
The New Relic Pixie integration persists select Pixie telemetry data for long-term storage. The default set of persisted data includes:
- HTTP (including HTTP/2) request spans and golden metrics (throughput, latency, error rate)
- DNS request spans and latency metrics
- MySQL request spans and golden metrics
- PostgreSQL request spans and golden metrics
- Cassandra request spans and golden metrics
- Redis request spans and golden metrics
- Kafka messages and golden metrics
- JVM metrics
You can configure which Pixie data is persisted in New Relic, including persisting additional Pixie telemetry data.
Configure which Pixie data is persisted in New Relic
Importante
The Customize Pixie Ingest feature requires version 2.X.X+ of the New Relic Pixie integration. You may need to upgrade your integration to access this feature.
You can configure which Pixie telemetry data is persisted in New Relic for long-term storage:
Select your cluster to navigate to the Kubernetes cluster explorer.
Select the Live debugging with Pixie tab.
Select the Customize Pixie Ingest button in the top right.

You can customize which Pixie telemetry data is persisted in New Relic within the Live debugging with Pixie tab.
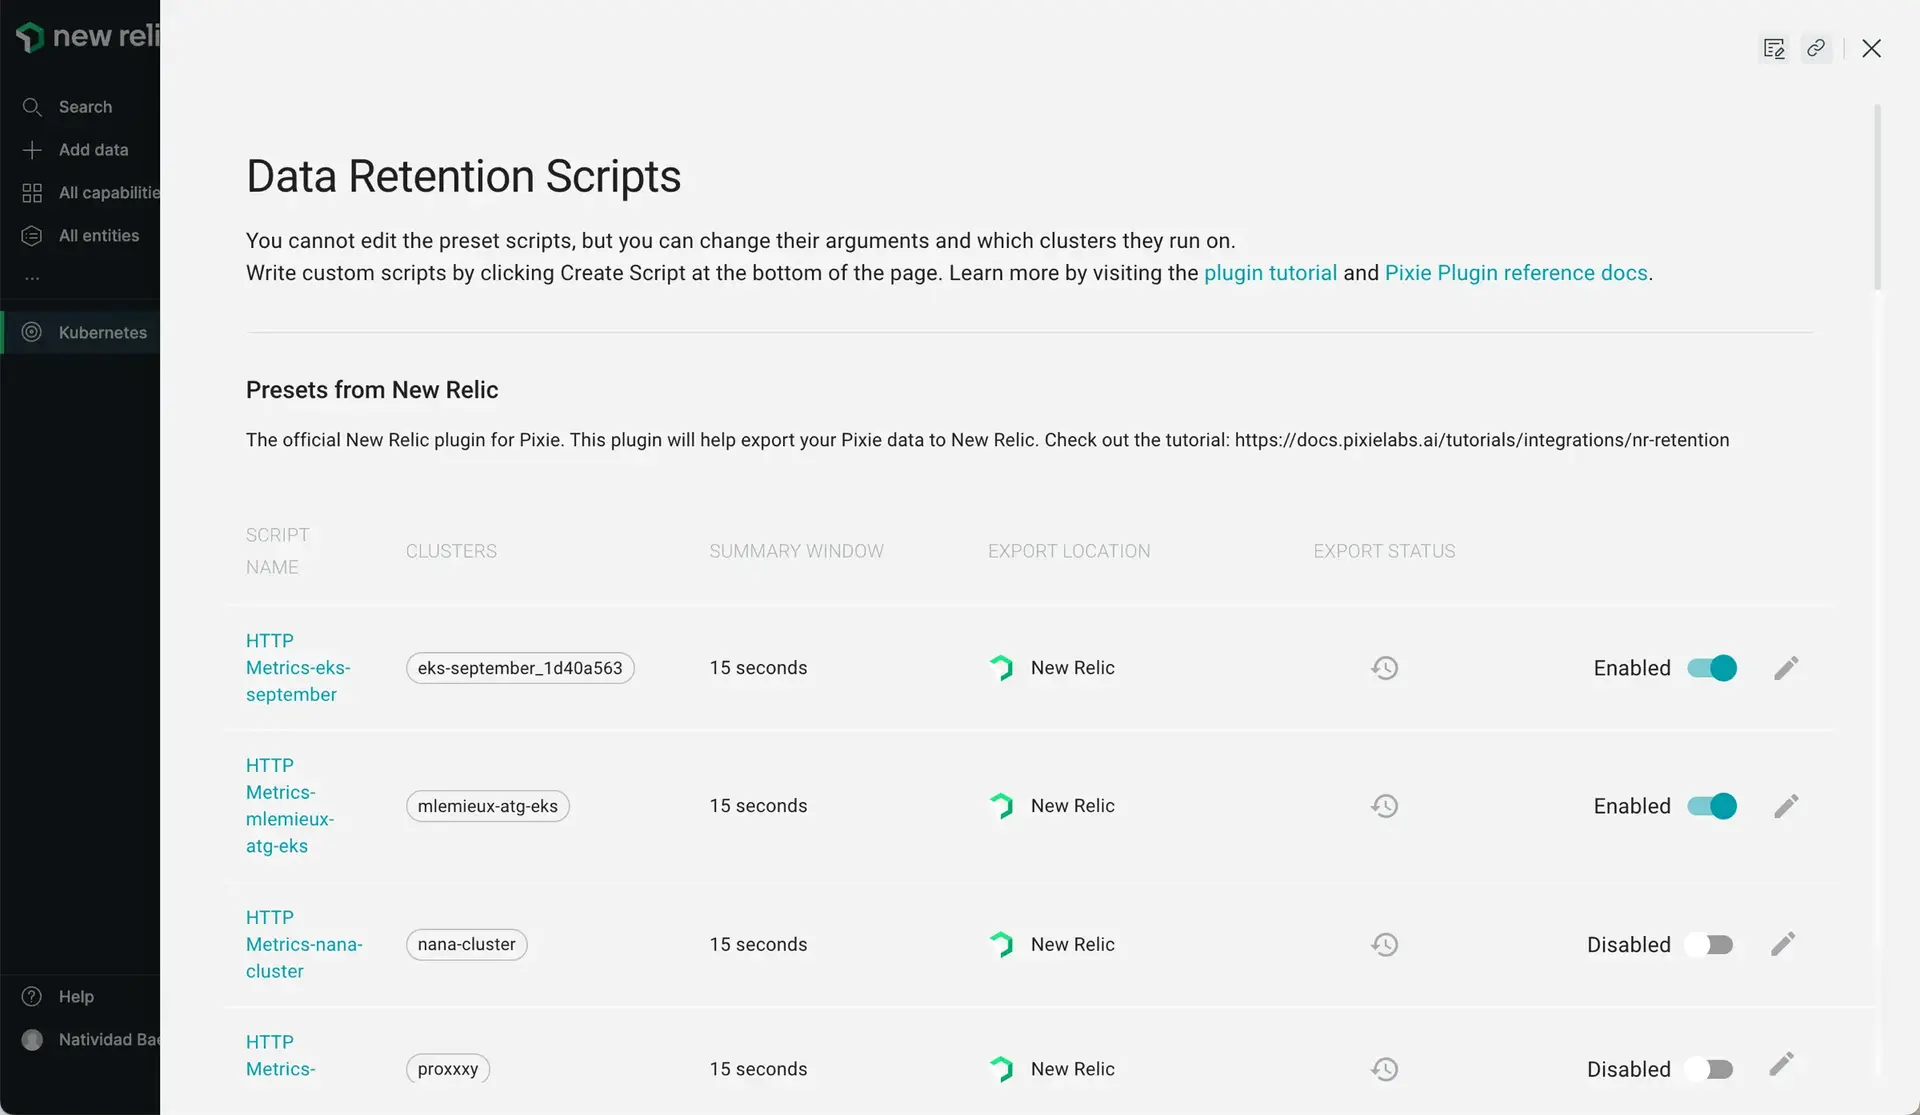
The New Relic Pixie integration uses Pixie's Plugin System to export select Pixie telemetry data to New Relic for long-term storage. The Customize Pixie Ingest page contains an embedded view of Pixie's plugin configuration page:

You can enable, disable, and add more export scripts to configure which Pixie telemetry data is ingested by New Relic.
By default, the New Relic Pixie integration includes several Pixie export scripts that are already enabled. You can choose to disable one or more of these scripts to reduce Pixie telemetry data ingest. Hover over a script name or click the edit button to see a description of the export script.
To export additional Pixie telemetry data to New Relic, use the + CREATE SCRIPT button. These scripts are written in Pixie’s PxL language and use Pixie’s OpenTelemetry export methods. To learn how to write a PxL script to export Pixie data in the OpenTelemetry format, check out this tutorial.