When you first install the Kubernetes integration , we deploy a default set of recommended alerts conditions and dashboards to your account that form the basis for alert conditions and dashboards on your Kubernetes cluster. Alert conditions are grouped into a couple of policies: Kubernetes alert policy and Google Kubernetes Engine alert policy .
While we've tried to address the most common use cases in all environments, there are a number of additional alerts you can set up to extend the default policy. See Getting started with New Relic alerts to know more about alerts.
Adding the recommended alert conditions and dashboards To add recommended alert policies and dashboards, follow these steps:
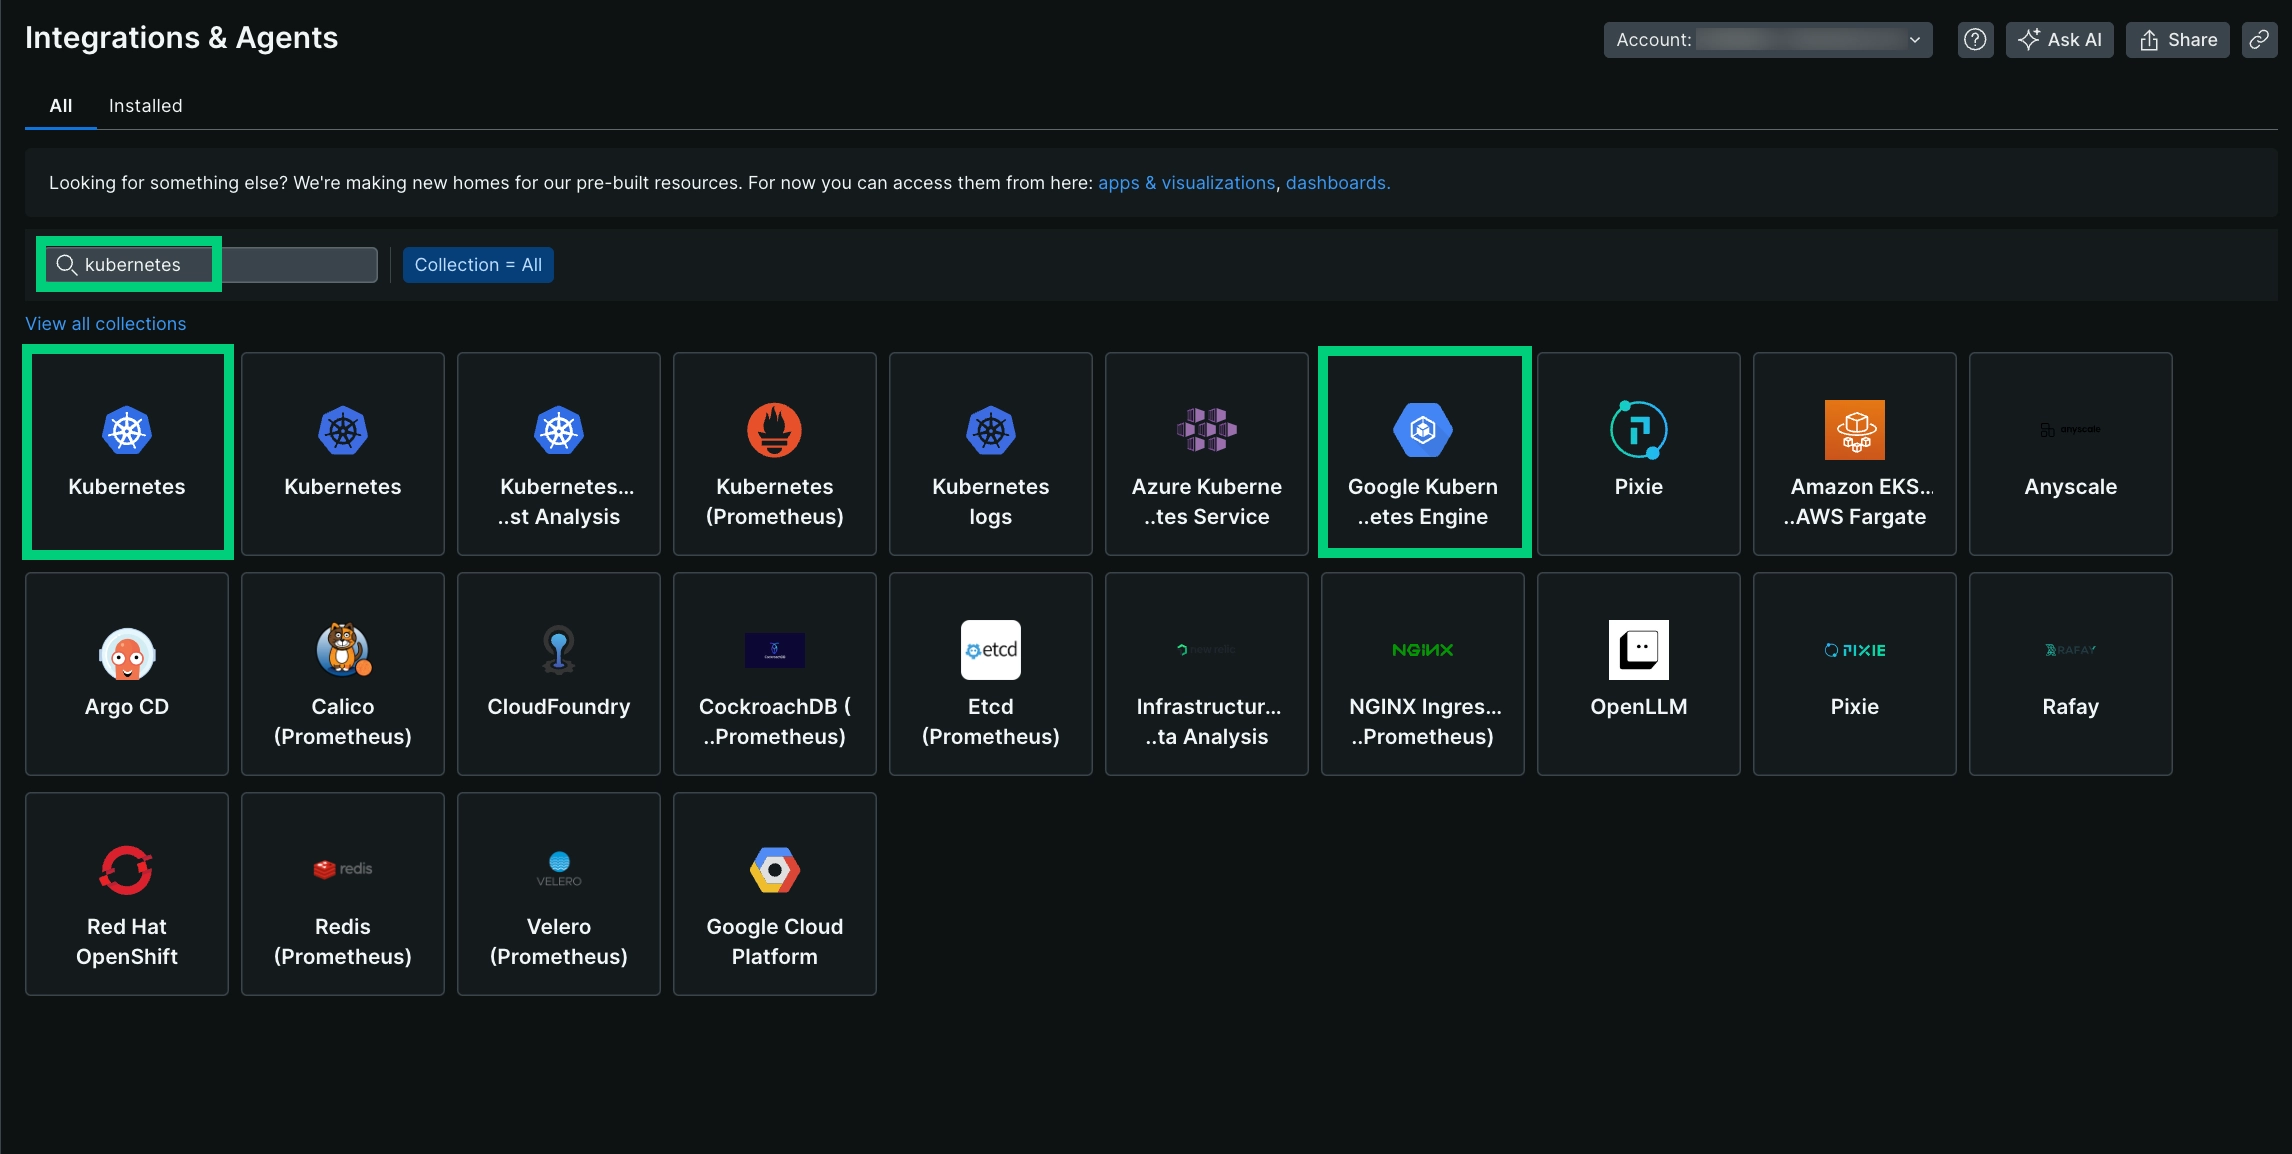
Go to one.newrelic.com > Integrations & Agents
In the search box, type kubernetes.
Select one of these options:
Kubernetes : To add the default set of recommended alert conditions and a dashboard.
Google Kubernetes Engine : To add the default set of recommended Google Kubernetes engine alert conditions and a dashboard.
Click Begin installation if you need to install the Kubernetes integration or click Skip this step if you already setup this integration.
Depending on the option you selected in step 3, you'll see different resources to add.
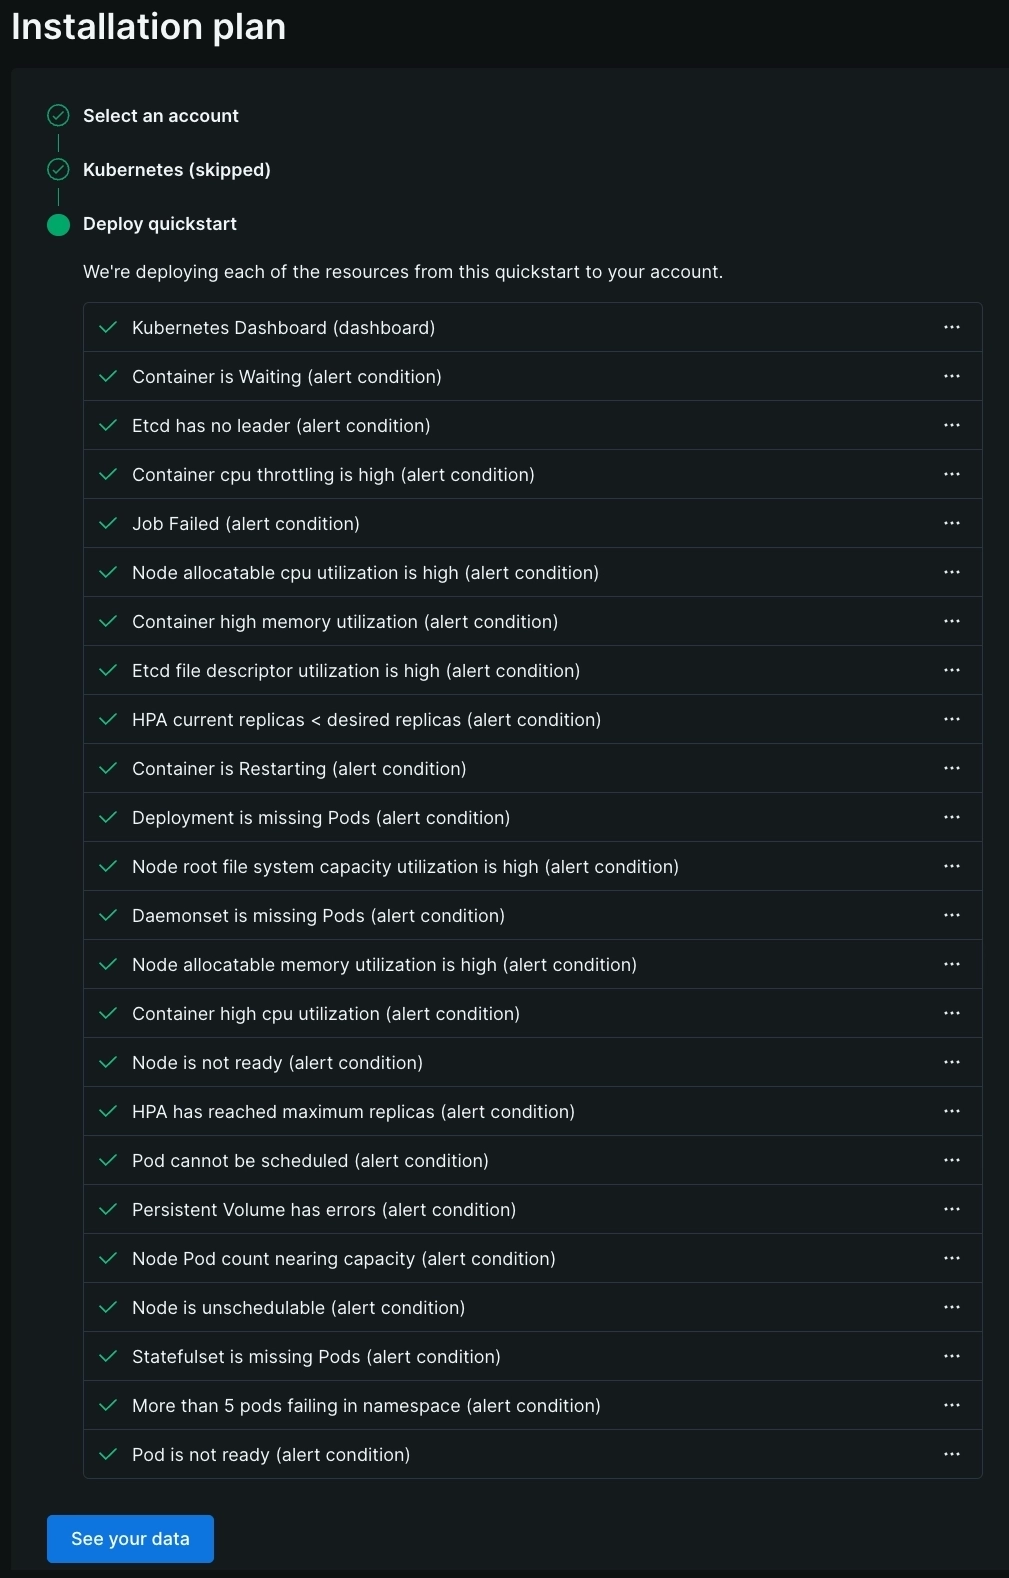
Default set of recommended alert conditions and a dashboard when you select Kubernetes in step 3.
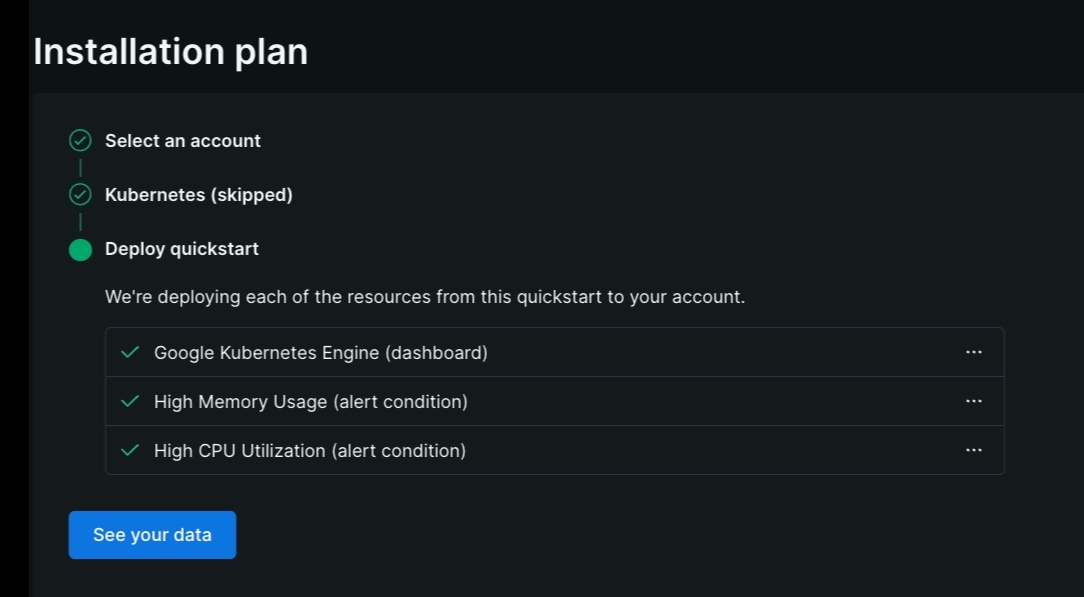
Default set of recommended Google Kubernetes engine alert conditions and a dashboard when you select Google Kubernetes Engine in step 3.
Click See your data to see a dashboard with your Kubernetes data in New Relic.
How to see the recommended alert policies To view the recommended alert policies you've added, do this:
Go to one.newrelic.com > All capabilities > Alerts
Click Alert Policies in the left navigation pane.
You'll see Kubernetes alert policy and Google Kubernetes engine alert policy .
How to see the Kubernetes dashboards There is a collection of recommended pre-built dashboards to help you instantly visualize your Kubernetes data for common use cases. See Manage your recommended dashboards to know how to see these dashboards.
Kubernetes alert policy This is the default set of recommended alert conditions you'll add:
Kubernetes Dashboard (dashboard) This dashboard includes charts and visualizations that help you instantly visualize your Kubernetes data for common use cases.
Container CPU throttling is high (alert condition) This alert condition generates an alert when a container is throttled by more than 25% for more than 5 minutes. It runs this query:
SELECT sum ( containerCpuCfsThrottledPeriodsDelta ) / sum ( containerCpuCfsPeriodsDelta ) * 100
WHERE clusterName IN ( 'YOUR_CLUSTER_NAME' )
AND namespaceName IN ( 'YOUR_NAMESPACE_NAME' )
FACET containerName , podName , namespaceName , clusterName
See the GitHub configuration file for more info.
Container high CPU utilization (alert condition) This alert condition generates an alert when the average container CPU usage against the limit exceeds 90% for over 5 minutes. It runs this query:
SELECT average ( cpuCoresUtilization )
WHERE clusterName IN ( 'YOUR_CLUSTER_NAME' )
AND namespaceName IN ( 'YOUR_NAMESPACE_NAME' )
FACET containerName , podName , namespaceName , clusterName
See the GitHub configuration file for more info.
Container high memory utilization (alert condition) This alert condition generates an alert when the average container memory usage against the limit exceeds 90% for over 5 minutes. It runs this query:
SELECT average ( memoryWorkingSetUtilization )
WHERE clusterName IN ( 'YOUR_CLUSTER_NAME' )
AND namespaceName IN ( 'YOUR_NAMESPACE_NAME' )
FACET containerName , podName , namespaceName , clusterName
See the GitHub configuration file for more info.
Container is restarting (alert condition) This alert condition generates an alert when container restarts exceed 0 in a 5-minute sliding window. It runs this query:
SELECT sum ( restartCountDelta )
WHERE clusterName IN ( 'YOUR_CLUSTER_NAME' )
AND namespaceName IN ( 'YOUR_NAMESPACE_NAME' )
FACET containerName , podName , namespaceName , clusterName
See the GitHub configuration file for more info.
Container is waiting (alert condition) This alert condition generates an alert when a container waits over 5 minutes. It runs this query:
SELECT uniqueCount ( podName )
WHERE status = 'Waiting' AND clusterName IN ( 'YOUR_CLUSTER_NAME' )
AND namespaceName IN ( 'YOUR_NAMESPACE_NAME' )
FACET containerName , podName , namespaceName , clusterName
See the GitHub configuration file for more info.
Daemonset is missing pods (alert condition) This alert condition generates an alert when the daemonset is missing any pods for a period longer than 5 minutes. It runs this query:
SELECT latest ( podsMissing )
WHERE clusterName IN ( 'YOUR_CLUSTER_NAME' )
AND namespaceName IN ( 'YOUR_NAMESPACE_NAME' )
FACET daemonsetName , namespaceName , clusterName
See the GitHub configuration file for more info.
Deployment is missing pods (alert condition) This alert condition generates an alert when the deployment is missing any pods for a period longer than 5 minutes. It runs this query:
SELECT latest ( podsMissing )
WHERE clusterName IN ( 'YOUR_CLUSTER_NAME' )
AND namespaceName IN ( 'YOUR_NAMESPACE_NAME' )
FACET deploymentName , namespaceName , clusterName
See the GitHub configuration file for more info.
Etcd file descriptor utilization is high (alert condition)This alert condition generates an alert when the Etcd file descriptor usage exceeds 90% for over 5 minutes. It runs this query:
SELECT max ( processFdsUtilization )
WHERE clusterName IN ( 'YOUR_CLUSTER_NAME' )
FACET displayName , clusterName
See the GitHub configuration file for more info.
Etcd has no leader (alert condition)This alert condition generates an alert when the Etcd file descriptor is leaderless for over 1 minute. It runs this query:
SELECT min ( etcdServerHasLeader )
WHERE clusterName IN ( 'YOUR_CLUSTER_NAME' )
FACET displayName , clusterName
See the GitHub configuration file for more info.
HPA current replicas < desired replicas (alert condition) This alert condition generates an alert when the current replicas of a horizontal pod autoscaler are lower than the desired replicas for more than 5 minutes. It runs this query:
SELECT latest ( desiredReplicas - currentReplicas )
WHERE clusterName IN ( 'YOUR_CLUSTER_NAME' )
AND namespaceName IN ( 'YOUR_NAMESPACE_NAME' )
FACET displayName , namespaceName , clusterName
See the GitHub configuration file for more info.
HPA has reached maximum replicas (alert condition) This alert condition generates an alert when a horizontal pod autoscaler exceeds 5 replicas. It runs this query:
SELECT latest ( maxReplicas - currentReplicas )
WHERE clusterName in ( 'YOUR_CLUSTER_NAME' )
AND namespaceName IN ( 'YOUR_NAMESPACE_NAME' )
FACET displayName , namespaceName , clusterName
See the GitHub configuration file for more info.
Job Failed (alert condition) This alert condition generates an alert when a job reports a failed status. It runs this query:
SELECT uniqueCount ( jobName )
WHERE failed = 'true' and clusterName in ( 'YOUR_CLUSTER_NAME' ) and namespaceName in ( 'YOUR_NAMESPACE_NAME' ) facet jobName , namespaceName , clusterName , failedPodsReason
See the GitHub configuration file for more info.
More than 5 pods failing in namespace (alert condition) This alert condition generates an alert when more than 5 pods in a namespace fail for more than 5 minutes. It runs this query:
SELECT uniqueCount ( podName )
WHERE clusterName IN ( 'YOUR_CLUSTER_NAME' )
AND namespaceName IN ( 'YOUR_NAMESPACE_NAME' )
FACET namespaceName , clusterName
See the GitHub configuration file for more info.
Node allocatable CPU utilization is high (alert condition) This alert condition generates an alert when the average node allocable CPU utilization exceeds 90% for more than 5 minutes. It runs this query:
SELECT average ( allocatableCpuCoresUtilization )
WHERE clusterName IN ( 'YOUR_CLUSTER_NAME' )
FACET nodeName , clusterName
See the GitHub configuration file for more info.
Node allocatable memory utilization is high (alert condition) This alert condition generates an alert when the average node allocable memory utilization exceeds 90% for more than 5 minutes. It runs this query:
SELECT average ( allocatableMemoryUtilization )
WHERE clusterName IN ( 'YOUR_CLUSTER_NAME' )
FACET nodeName , clusterName
See the GitHub configuration file for more info.
Node is not ready (alert condition) This alert condition generates an alert when a node is unavailable for 5 minutes. It runs this query:
SELECT latest ( condition . Ready )
WHERE clusterName IN ( 'YOUR_CLUSTER_NAME' )
FACET nodeName , clusterName
See the GitHub configuration file for more info.
Node is unschedulable (alert condition) This alert condition generates an alert when a node is marked unscheduled. It runs this query:
SELECT latest ( unschedulable )
WHERE clusterName IN ( 'YOUR_CLUSTER_NAME' )
FACET nodeName , clusterName
See the GitHub configuration file for more info.
Node pod count nearing capacity (alert condition) This alert condition generates an alert when a node's running pods exceed 90% of the node's pod capacity for more than 5 minutes. It runs this query:
FROM K8sPodSample , K8sNodeSample
) / latest ( capacityPods ) * 100
WHERE nodeName != '' AND nodeName IS NOT NULL
AND clusterName IN ( 'YOUR_CLUSTER_NAME' )
FACET nodeName , clusterName
See the GitHub configuration file for more info.
Node root file system capacity utilization is high (alert condition) This alert condition generates an alert when the average node root file system capacity utilization exceeds 90% for more than 5 minutes. It runs this query:
SELECT average ( fsCapacityUtilization )
WHERE clusterName IN ( 'YOUR_CLUSTER_NAME' )
FACET nodeName , clusterName
See the GitHub configuration file for more info.
Persistent volume has errors (alert condition) This alert condition generates an alert when persistent volume is in a failed or pending state for more than 5 minutes. It runs this query:
FROM K8sPersistentVolumeSample
SELECT uniqueCount ( volumeName )
WHERE statusPhase IN ( 'Failed' , 'Pending' )
AND clusterName IN ( 'YOUR_CLUSTER_NAME' )
FACET volumeName , clusterName
See the GitHub configuration file for more info.
Pod cannot be scheduled (alert condition) This alert condition generates an alert when a pod is unable to be scheduled for more than 5 minutes. It runs this query:
SELECT latest ( isScheduled )
WHERE clusterName IN ( 'YOUR_CLUSTER_NAME' )
AND namespaceName IN ( 'YOUR_NAMESPACE_NAME' )
FACET podName , namespaceName , clusterName
See the GitHub configuration file for more info.
Pod is not ready (alert condition) This alert condition generates an alert when a pod is unavailable for over 5 minutes. It runs this query:
WHERE status NOT IN ( 'Failed' , 'Succeeded' )
AND clusterName IN ( 'YOUR_CLUSTER_NAME' )
AND namespaceName IN ( 'YOUR_NAMESPACE_NAME' )
FACET podName , namespaceName , clusterName
See the GitHub configuration file for more info.
statefulset is missing pods (alert condition)This alert condition generates an alert when statefulset is missing pods over 5 minutes. It runs this query:
FROM K8sStatefulsetSample
SELECT latest ( podsMissing )
WHERE clusterName IN ( 'YOUR_CLUSTER_NAME' )
AND namespaceName IN ( 'YOUR_NAMESPACE_NAME' )
FACET daemonsetName , namespaceName , clusterName
See the GitHub configuration file for more info.
Google Kubernetes engine alert policy This is the default set of recommended Google Kubernetes engine alert conditions you'll add:
Google Kubernetes Engine (dashboard) This dashboard includes charts and visualizations that help you instantly visualize your Google Kubernetes data for common use cases.
High CPU utilization (alert condition) This alert condition generates an alert when a node's CPU utilization exceeds 90% for at least 15 minutes. It runs this query:
SELECT max ( ` gcp.kubernetes.node.cpu.allocatable_utilization ` ) * 100
WHERE clusterName LIKE '%' FACET gcp . kubernetes . nodeName
See the GitHub configuration file for more info.
High memory usage (alert condition) This alert condition generates an alert when a node's memory usage exceeds 85% of its total capacity. It runs this query:
SELECT max ( gcp . kubernetes . node . memory . allocatable_utilization ) * 100
WHERE clusterName LIKE '%' FACET gcp . kubernetes . nodeName
See the GitHub configuration file for more info.


