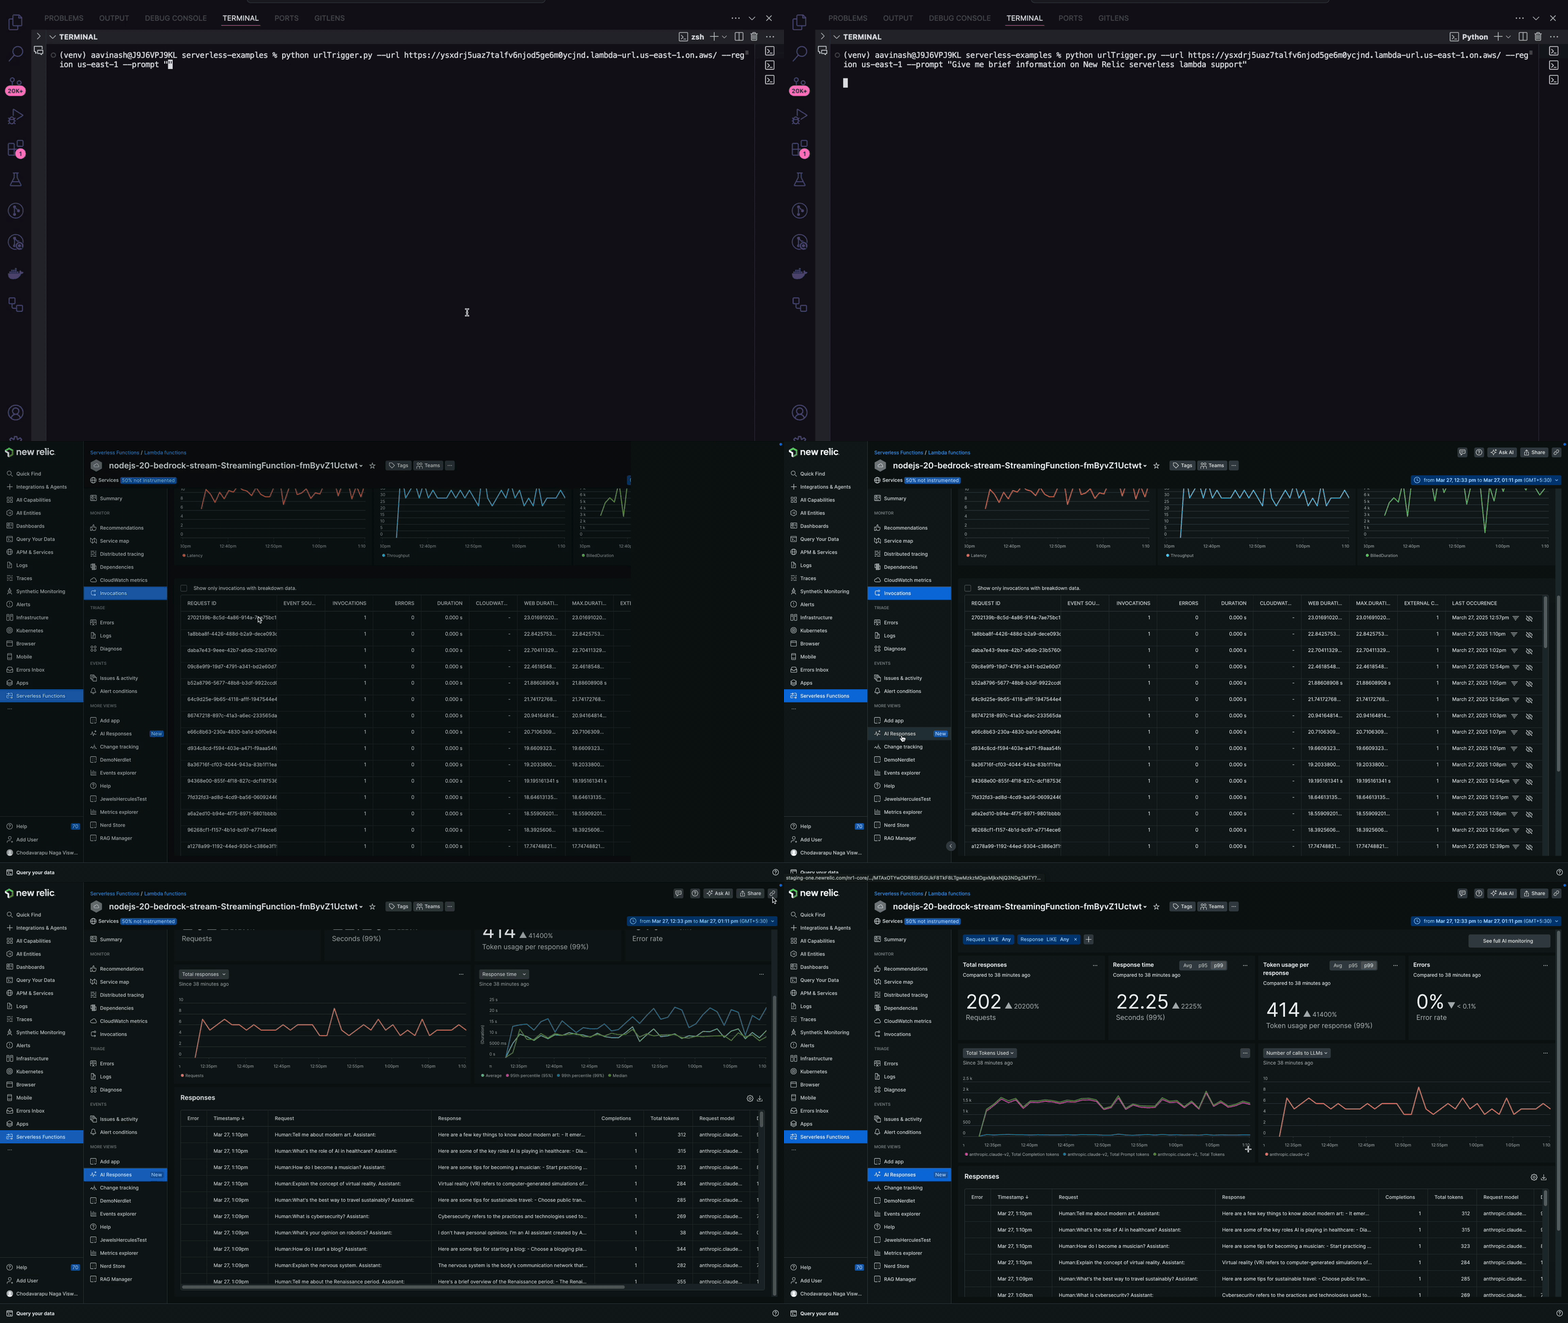
You can monitor AWS Lambda functions that use response streaming in Node.js applications to get real-time insights into the performance and behavior of each invocation. This solution integrates with AI monitoring to allow you to track model responses and collect observability data related to your AI workloads. Using these capabilities, you can optimize your serverless applications' performance and maintain comprehensive oversight of AI-driven processes.
This document helps you to:
- Set up monitoring response streaming Lambda functions
- Understand the metrics and data available for response streaming Lambda functions
- Learn how to use the New Relic UI to monitor and observe the performance of your response streaming Lambda functions

Set up the Lambda response streaming
Prerequisites
- Check that your Lambda function meets our compatibility and requirements.
- Use the latest lambda layer available for Node.js.
Configure the Lambda response streaming
To enable response streaming monitoring for your Node.js Lambda functions:
Install and configure Lambda monitoring on New Relic.
Add the required environment variables for Node.js response streaming Lambda functions.
Save the changes and deploy the function.
After deployment, you can view the Lambda response streaming data in the New Relic platform. For more information, refer to Access the Lambda response streaming data.
Access the Lambda response streaming data
To view the Lambda response streaming data in the New Relic platform:
Go to one.newrelic.com > left navigation pane > All Capabilities > Serverless Functions.
Select the required Lambda function that uses response streaming.
View Summary, Invocations, CloudWatch metrics, and distributed tracing for your response streaming Lambda functions.
In the More views section, click AI Responses.
To know more about AI responses, refer to View AI responses.
Key metrics for response streaming
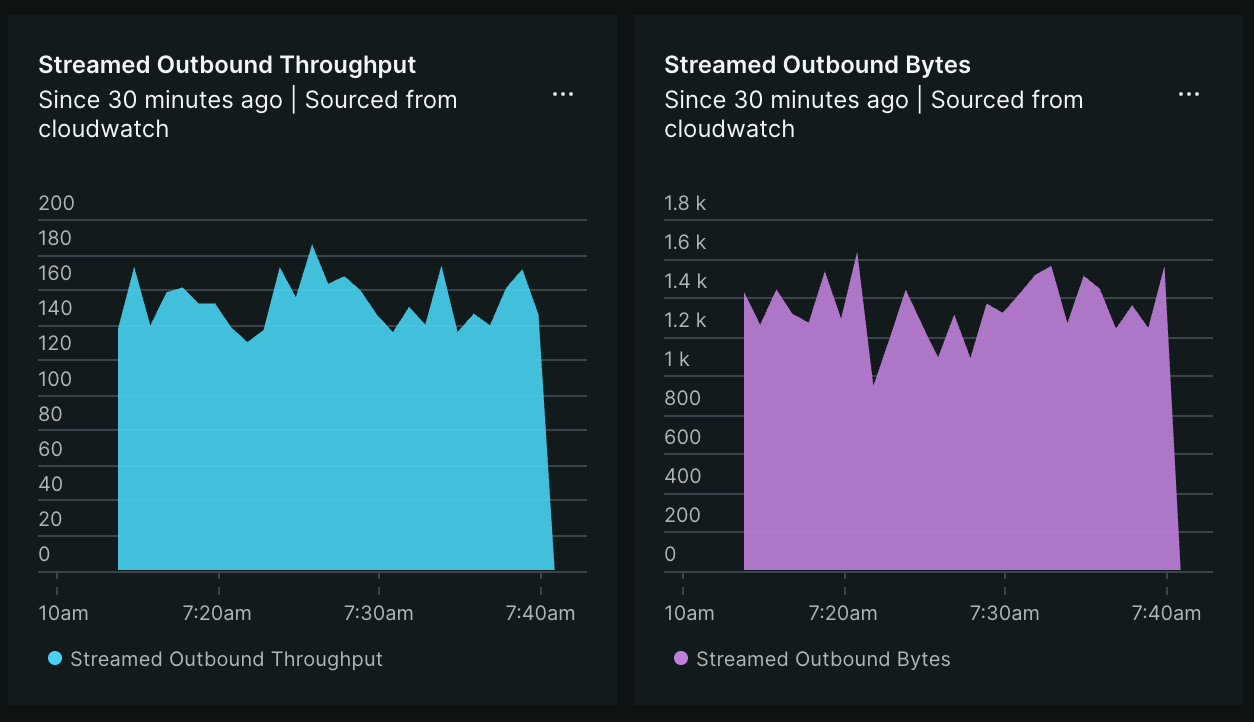
On the Cloudwatch metrics page, monitor the following metrics related to response streaming:
- Streamed Outbound Bytes: Displays the average number of bytes streamed out by the Lambda function.
- Streamed Outbound Throughput: Displays the average rate at which bytes are streamed out by the Lambda function.

For more about our UI, see Intro to the New Relic platform.