After you create your set of SLIs and SLOs, New Relic will start generating SLI data. The first results will take a few minutes to appear in our UI.
Find and view service levels
You have several ways to find service levels:
- At the top nav bar, under Service Levels in the More menu (which you can customize). Here you can filter the SLIs by their tags.
- At the previews of those entities that have an SLI defined. You can find them all around the UI. For instance, click on an entity from the Explorer's Navigator view.
- In APM services, at the reports section.
- In any workload that contains the SLI or the SLI related entity, such as an service or browser application. If you want to group SLIs under a certain workload, make sure to add the APM service or browser app to an existing workload, or create a new one.
The service levels list shows one service level per row, with the service level name, its related entity, and the SLO target and period.
Filter service levels
If you add tags to your service levels, use the filter bar to scope down the service levels that you get, and group them.
- Use filtering to hide any testing or aspirational service levels that the team hasn't committed to yet.
- Use grouping to focus on those service levels linked to a specific owner, organizational unit, or user flow.
SLO compliance view modes
Depending on what you're trying to achieve, use one the following view modes to verify SLO compliance:
- Operational: When in charge of operating a service, use this view to see how the SLO compliance and error budget are trending for the past 2-hour, and 1, 7, and 28-day rolling windows.
- Period over period: For business reviews, retrospectives and prioritization meetings, use this view to compare compliance per calendar week or month.
Note that request-based SLOs are determined from SLIs defined as the ratio of the number of good responses to the total number of requests. This means a request-based SLO is met when that ratio meets or exceeds the goal for the SLO compliance period.
Also, SLO compliance results for rolling time windows are more consistent when they include complete weeks. Therefore, SLO periods only include complete weeks. This way, the calculation always includes the same amount of weekends, and any weekly seasonality doesn't impact the results depending on which day of the week you look at SLOs.
View SLOs for operations
The operational view shows how your service levels are improving or degrading in different time windows.
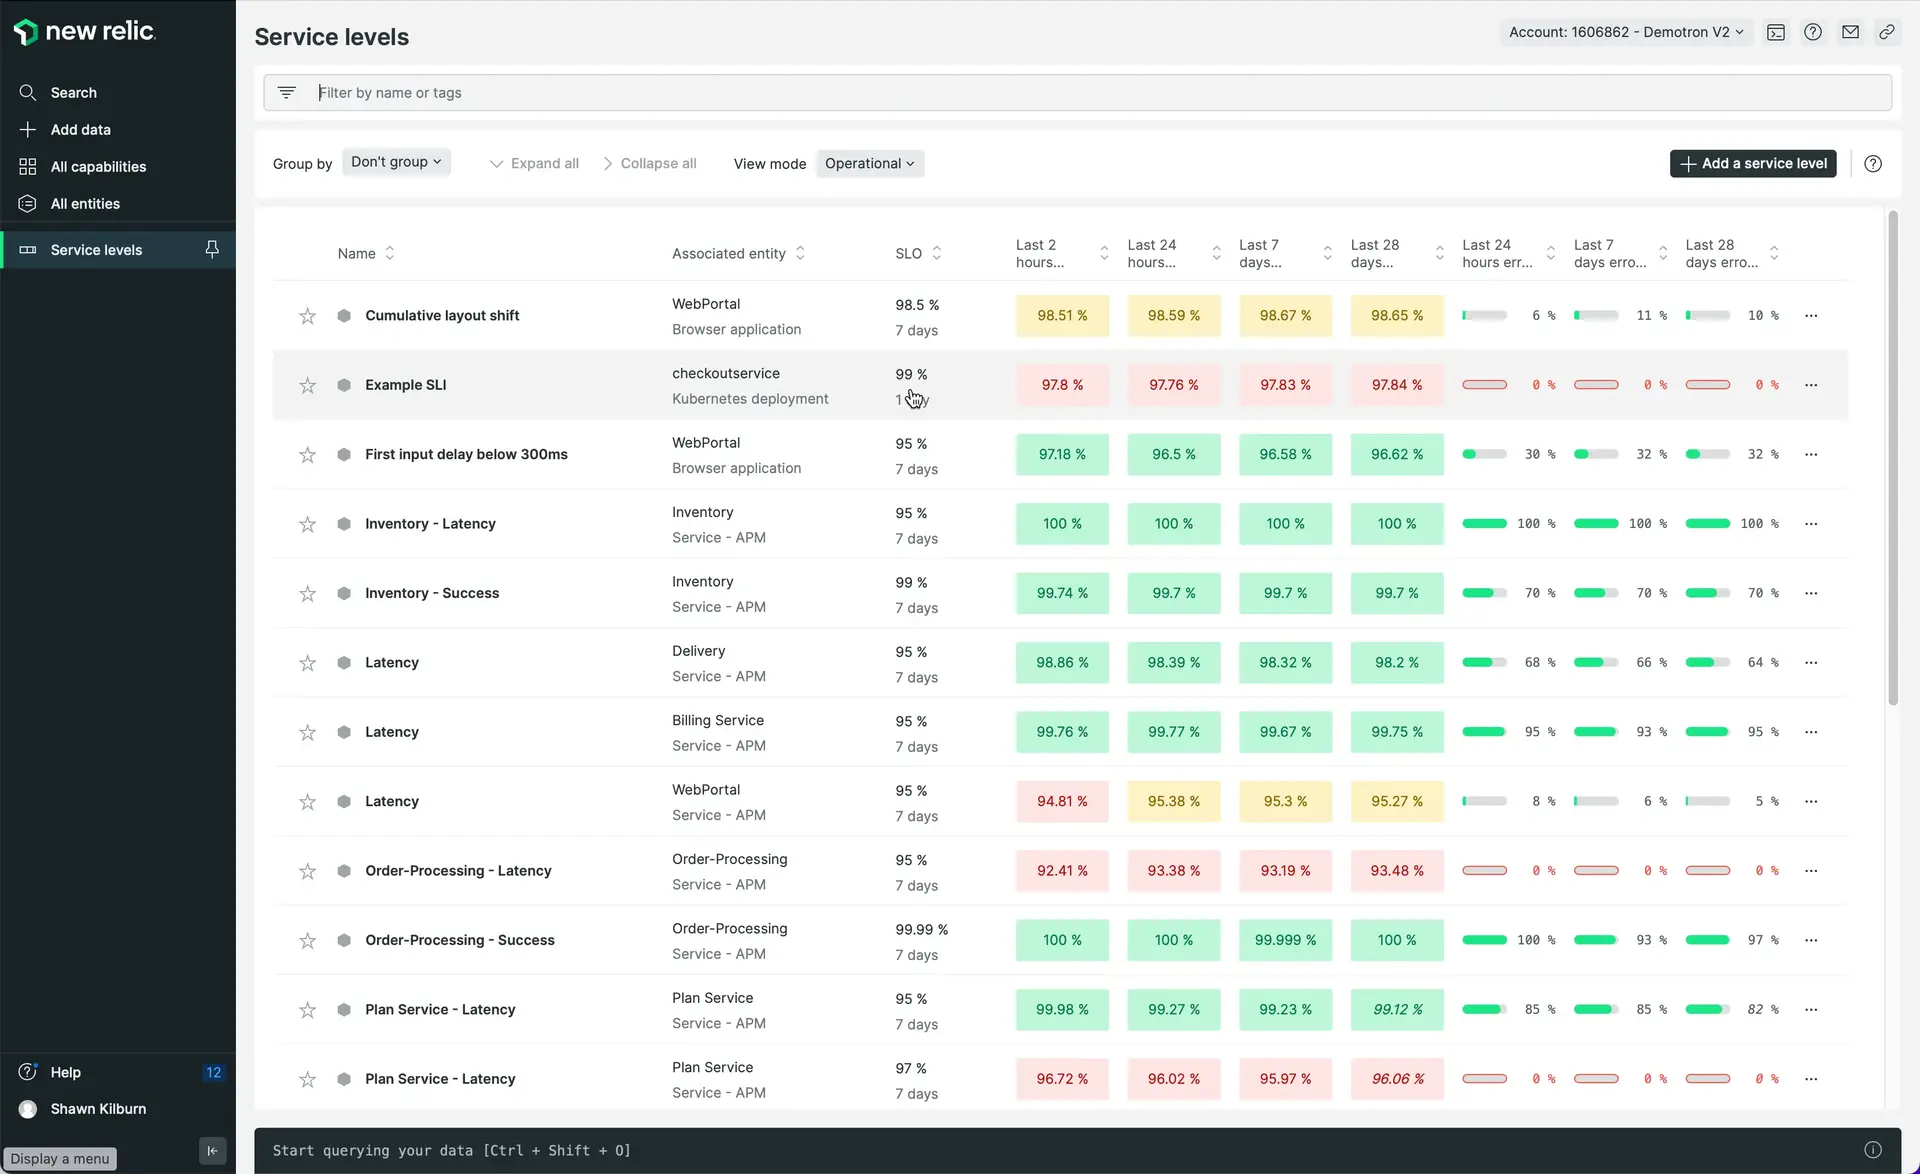
one.newrelic.com > All capabilities > Service levels
- If the SLO compliance cell has a green background, you're doing good for the period. You may have not served successfully 100% of the requests, but you still have some remaining error budget to consume.
- If the SLO compliance cell has a yellow background, your error budget is closer to being totally consumed, and you should be more cautious for the rest of the period.
- If the SLO compliance cell has a red background, you've not reached the target SLO in this period, and you've consumed all of your error budget. Be careful if you need to deploy, and plan some work to improve your SLIs. You can click on the SLO to see more data about the entity, such as the golden metrics, the latest deployments, anomalies, and ongoing issues. This data can help you understand when and why you missed the SLO targets.
The 2-hour window can surface incidents that are quickly and significantly impacting your clients. If this SLO is not met, start an investigation and make sure your service doesn't continue to degrade. On the other hand, longer time windows can surface issues that are not serious enough to breach alert conditions, and could go undetected otherwise.
You will also get the remaining error budget for the last 1, 7 and 28 rolling days to check how fast you're recovering or consuming the error budget.
View SLOs over periods for business reviews
Use the period-over-period view for reporting in review meetings which happen with a certain calendar frequency. This view's added value is to show a longer history of your SLO compliance over time windows in a given calendar period.
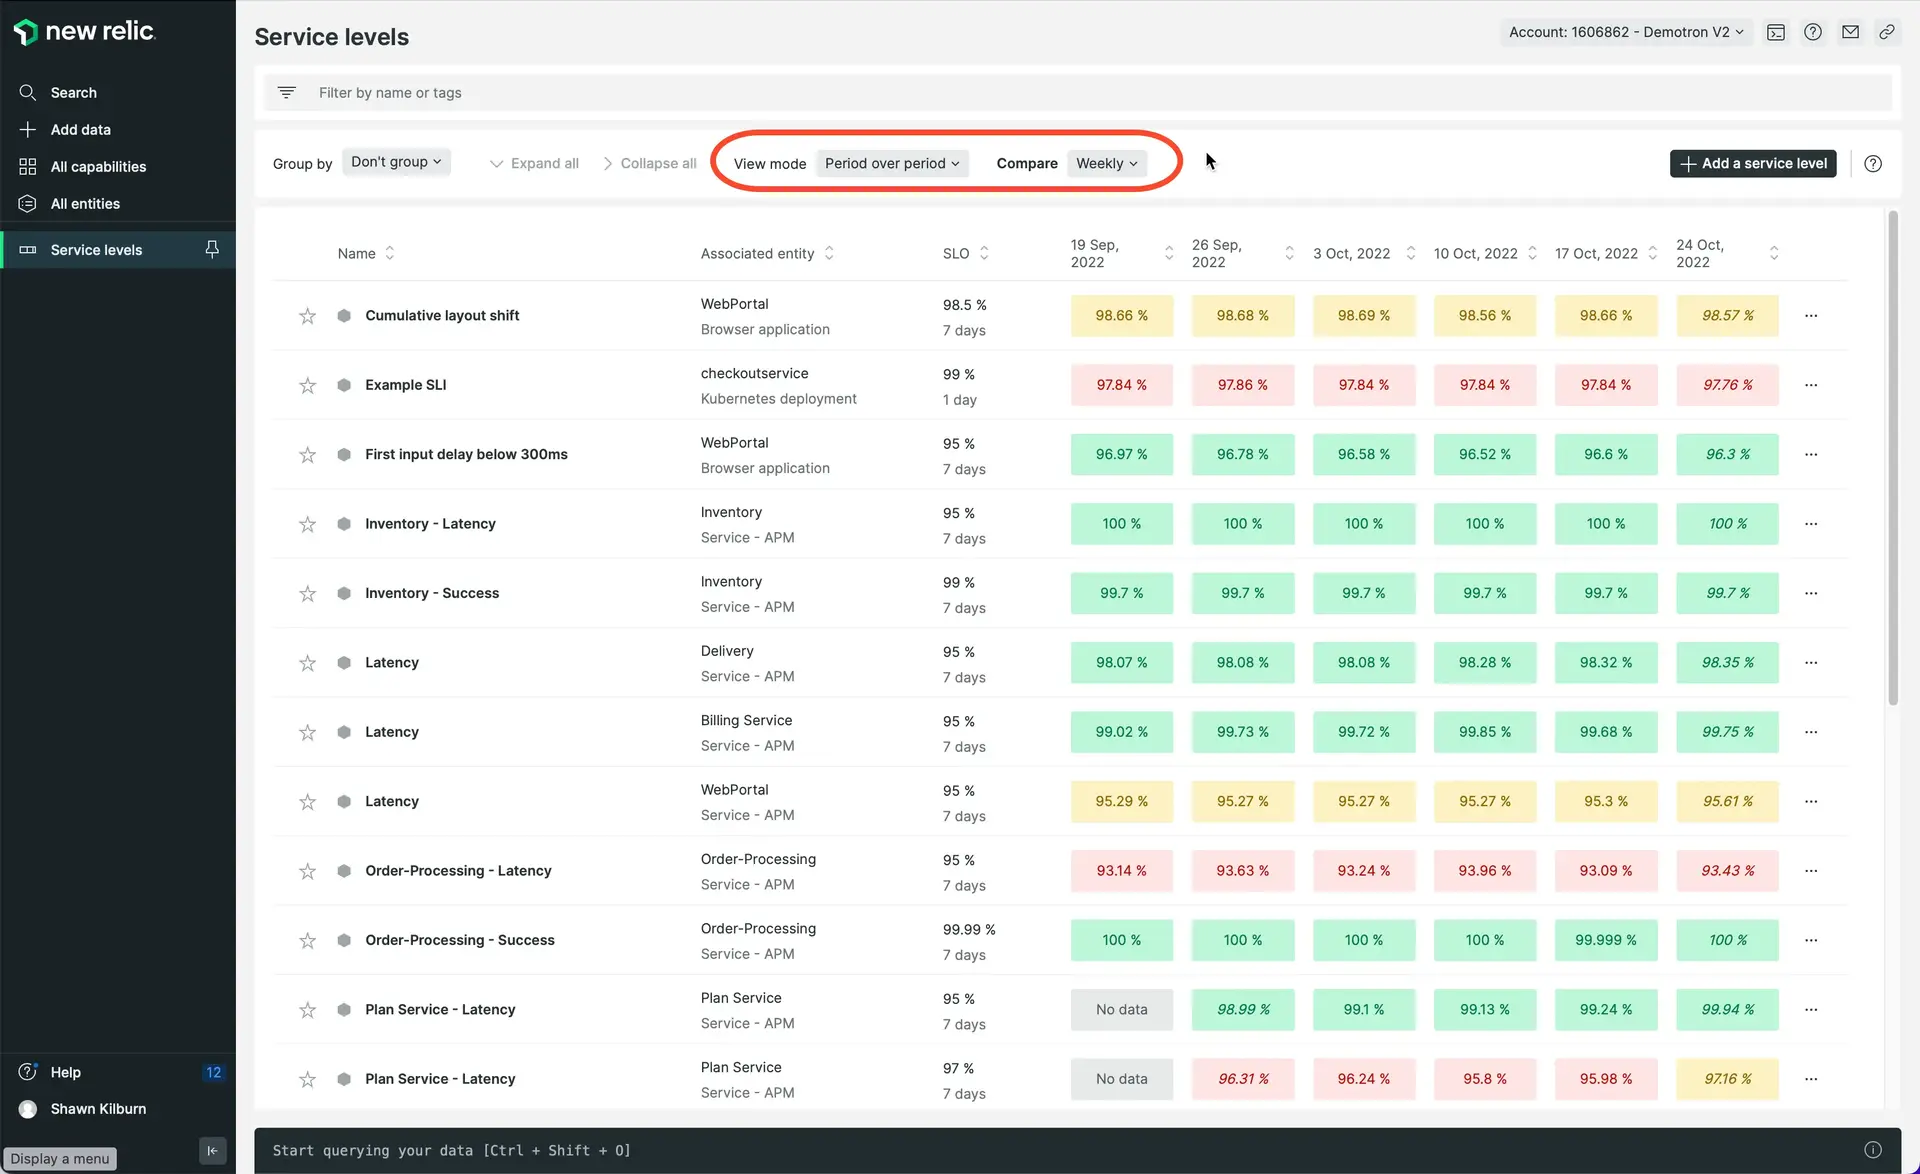
one.newrelic.com > All capabilities > Service levels
- You can switch the period between weeks and months.
- The cell color works exactly as described on the operations view.
Understand service levels details
Click on any SLI to open the SLI details:
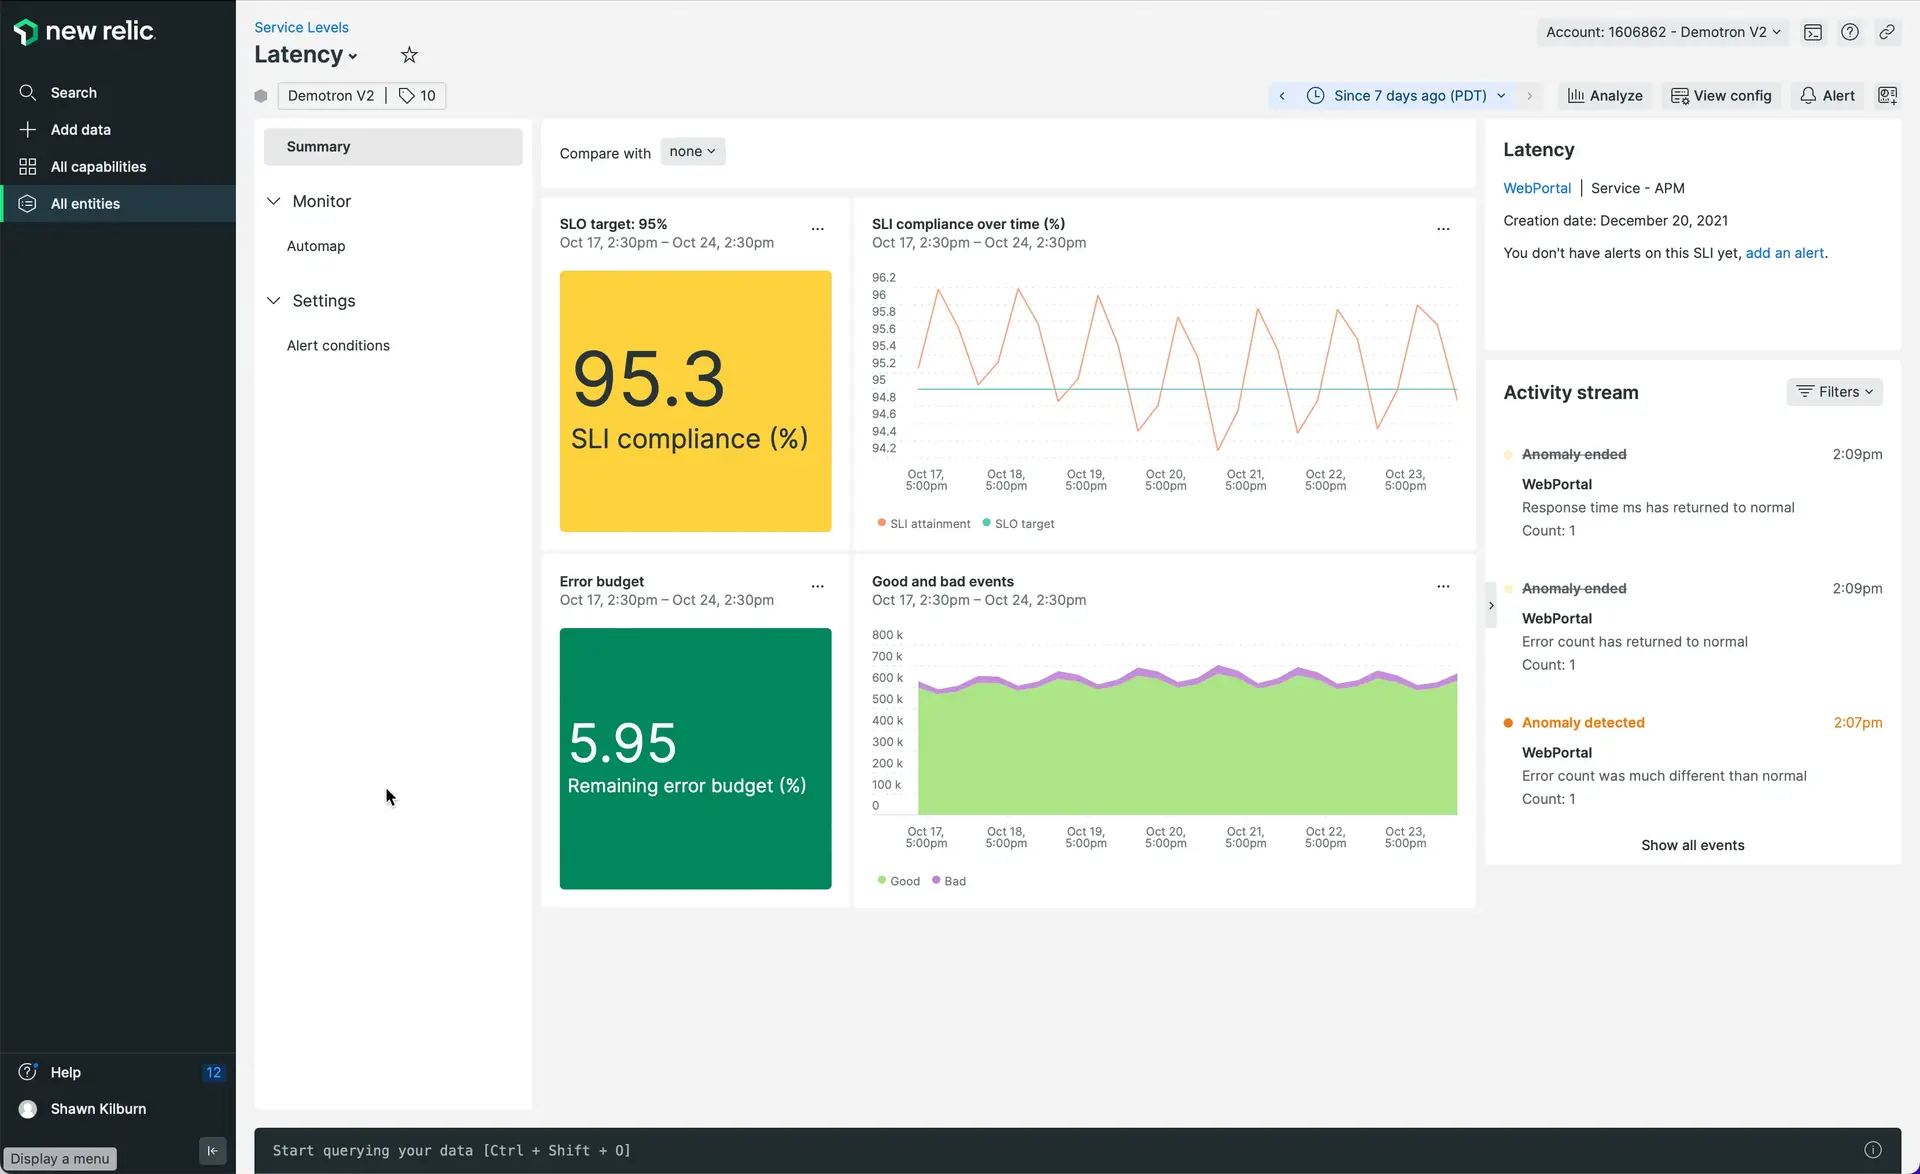
one.newrelic.com > All capabilities > Service levels, and select an SLI.
Use the SLI details for two main purposes:
- For SLO analysis: See in which time ranges the SLO targets were missed.
- For SLI/SLO configuration and fine tuning: Learn how New Relic calculated SLO values.
The SLI card contains the following charts:
Good and bad responses
These are the key concepts to analyze service levels:
- A valid request is any request that you want to count as meaningful for your SLIs.
- A good response is any response that you consider to provide a good experience (for example, the service responded in less than 2 seconds, providing a good navigation experience for the end user).
- A bad response is any response that you consider to provide a bad experience (like the service responded with a server error, interrupting the user's flow).
This chart shows the total number of valid requests that your service received, broken down by good or bad.
This chart shows the actual throughput of your service, which you can use to see if there’s any correlation between the increase of throughput and bad responses.
SLI attainment over time (%)
It's the proportion of what you consider good responses over time. The line should stay close to 100%, meaning that most requests were served successfully.
Compliance over the period
It's the ratio of good events (responses) to total events (requests), measured over the SLO compliance period. The closer to 100%, the closer your service is to meet the SLO target over the period. When this percentage goes below the SLO target, the chart will turn red: You need to put more effort in reliability.
Remaining error budget (Requests)
The remaining error budget indicates what percentage of requests could still have a bad response over the SLO period without compromising the objective. Therefore, the total amount of tolerated bad responses will vary with the throughput of requests.
The error budget is an alternative way to read the SLO. It indicates what percentage of requests could still have a bad response over the SLO period, without compromising the objective.
As the total amount of tolerated bad responses will vary with the request throughput, New Relic shows the percentage of remaining error budget:
- As long as the remaining error budget is above 25%, you'll see green, and your SLO is good.
- When the error budget goes below 25%, it will turn yellow. This means you're close to burning the whole budget for the period. You may want to be more careful with new deployments and changes, and plan for some reliability work.
- Once the error budget is completely spent, it will show in red.
SLI attainment over time and SLO target (%)
The last chart shows two time series: the SLI attainment over time, and the SLO target. When the SLI value is below the SLO target, your service is missing the SLO. Use this chart to learn in which time ranges your service missed the SLO target.
Charting the SLI attainment on a dashboard
You can chart SLI attainment time series on your custom dashboards using the following query:
FROM Metric SELECT clamp_max( (count(newrelic.sli.valid) - count(newrelic.sli.bad)) / count(newrelic.sli.valid) * 100, 100) AS 'SLI attainment' WHERE sli.id = 'SLI_ID' UNTIL 2 MINUTES AGO TIMESERIES AUTOWhere sli.id is the SLI identifier. The easiest way to add a chart like this to your dashboard is by using the Add to dashboard option, available on the Details view.
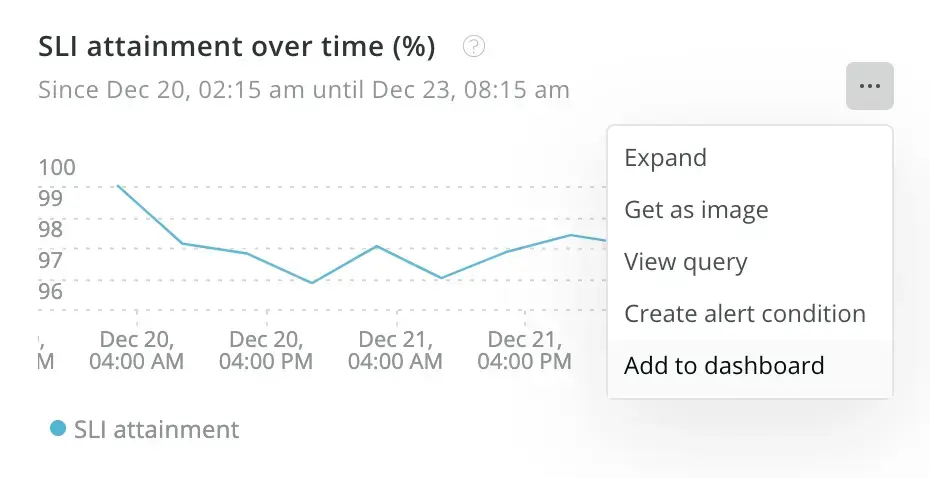
Alternatively, you can find the SLI id and SLI attainment query through the Nerdgraph API with the following query:
{ actor { entity(guid: "{entityGuid}") { serviceLevel { indicators { name id resultQueries { indicator { nrql } } } } } }}Use the entityGuid of the entity that's associated with the SLI. On the query results, you’ll get the SLI id in the serviceLevel.indicators.id field.
Diagnosing SLO breaches
To help you diagnose SLO breaches you can:
Group your bad events
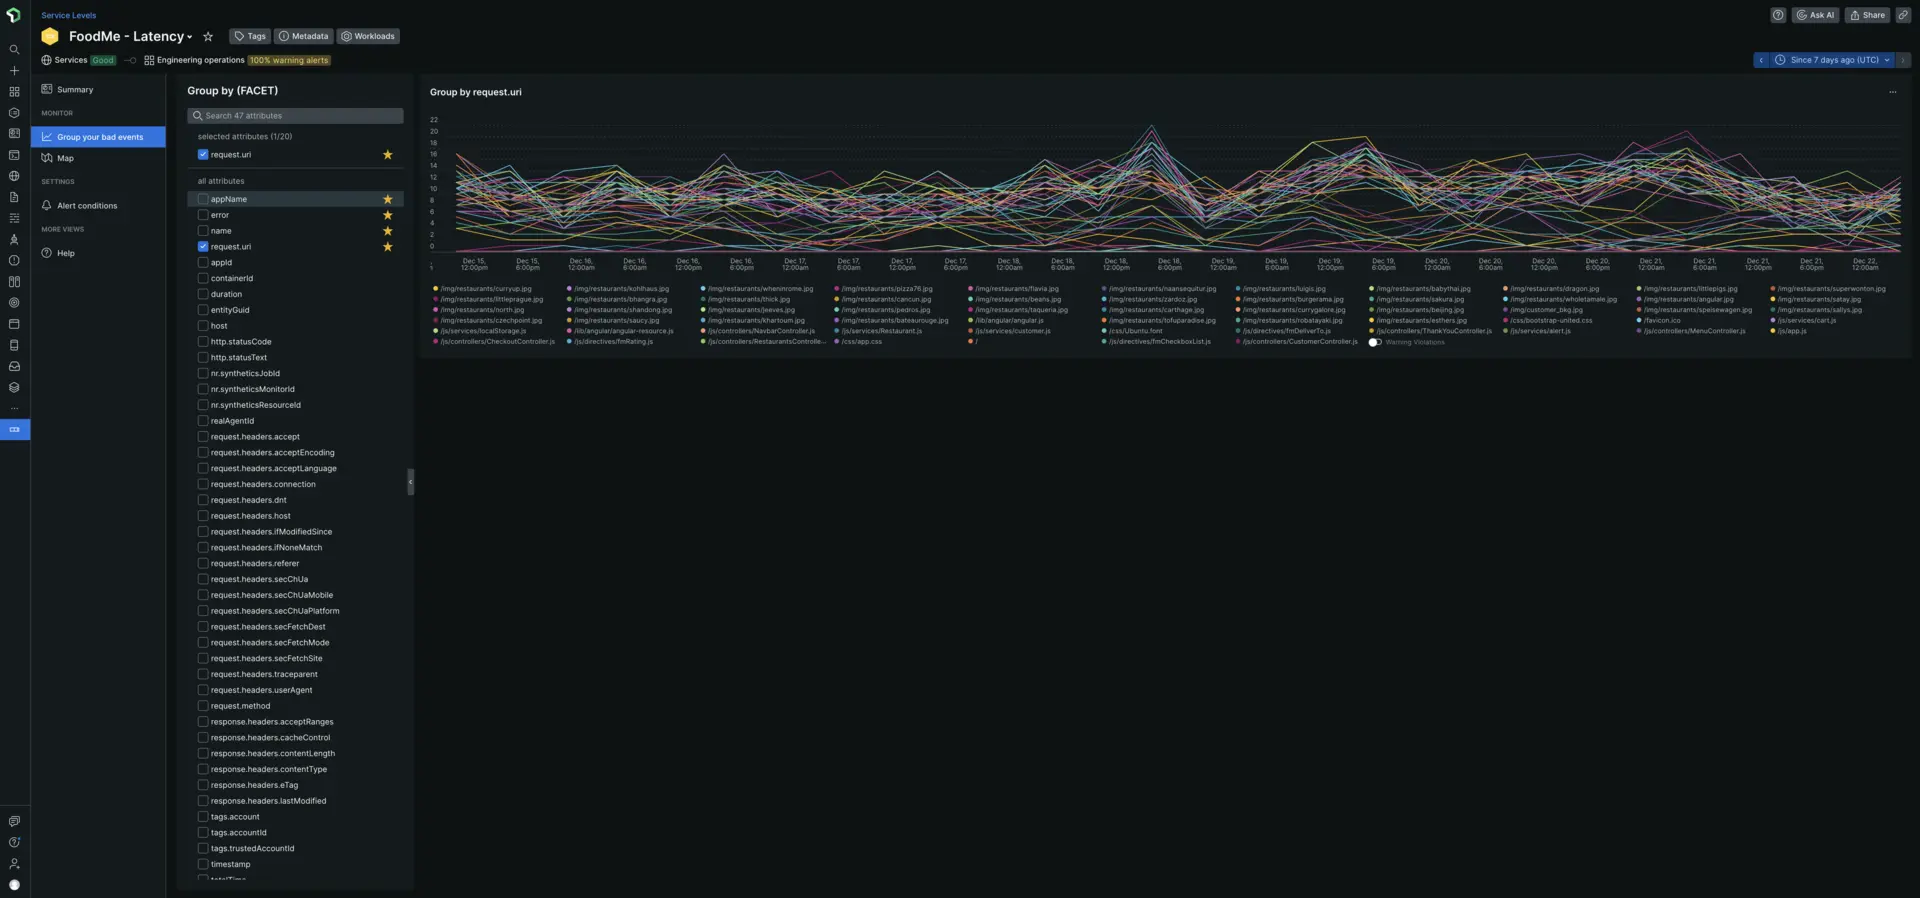
one.newrelic.com > All capabilities > Service levels, and select an SLI.
You can select a certain attribute (such as account, client id, requesting source, etc.), and detect if it particularly damages the SLO. We'll call these damaging values "detractors".
For example, for transaction data, try and facet by name to see if any of the transactions for the service is returning more unsuccessful results than the rest. To learn which client is getting the highest number of unsuccessful results, try and facet by request.uri.
Another example, you can try faceting the browser PageViewTiming events, by deviceType, userAgentName, userAgentOS, countryCode, etc.
When you detect that one or very few detractors are really degrading SLO compliance, you can take several actions:
- First, troubleshoot the issue, and plan work to have the detractor meet the SLO.
- You can also temporarily adjust the SLO target to a more realistic value, and plan work to improve reliability.
But if the detractor is really an exception that won't easily match the general expectations for your service performance and reliability, consider having a dedicated SLO for that case. We recommend these steps:
- First, use a
WHEREclause on the original SLI queries to filter out the detractor (for example,WHERE countryCode != 'US'). - Then, create a new SLI with a
WHEREclause on the queries that only takes into account the detractor case (for example,WHERE countryCode = 'US'), and set a more realistic SLO target for it.
Sugerencia
Even if you configured your SLI based on good events, you can use the bad events query to find any detractors that might exist.
Limitations
There are a few exceptions where you can't calculate the bad events query:
- For SLIs configured on good events where the event types are different.
- For SLIs configured on good events where the good events have no filter.
- For SLIs configured on good events that use both SUM and COUNT.
- For SLIs configured on good events that use SUM with different attributes.
Relationships map
With relationships map, you can pinpoint when and where an issue began by viewing the relationships around your affected service level.
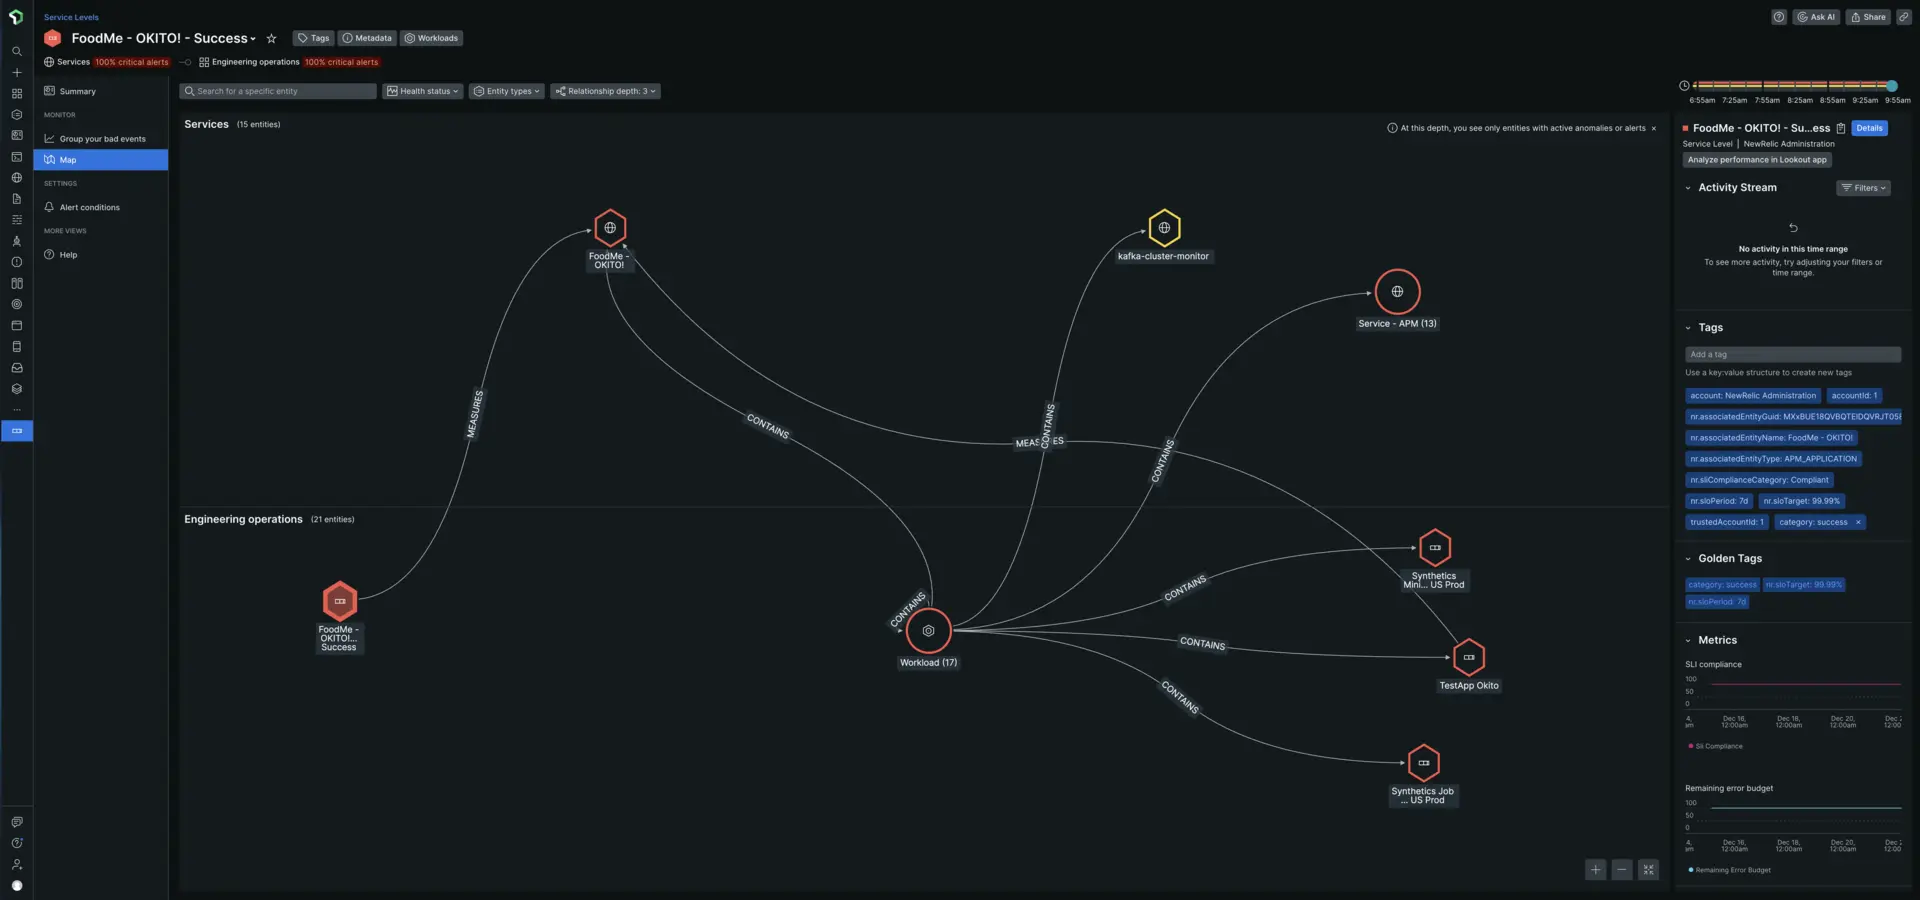
one.newrelic.com > All capabilities > Service levels > (select an SLI) > Map.