Preparing for your company's big event is a challenge. It pushes you and your team to rethink your system architecture from a business point of view, then asks you to make a series of judgment calls when multiple critical alert events arise. How do you make gameday a success when you can't prioritize everything all at once? How do you find what matters?
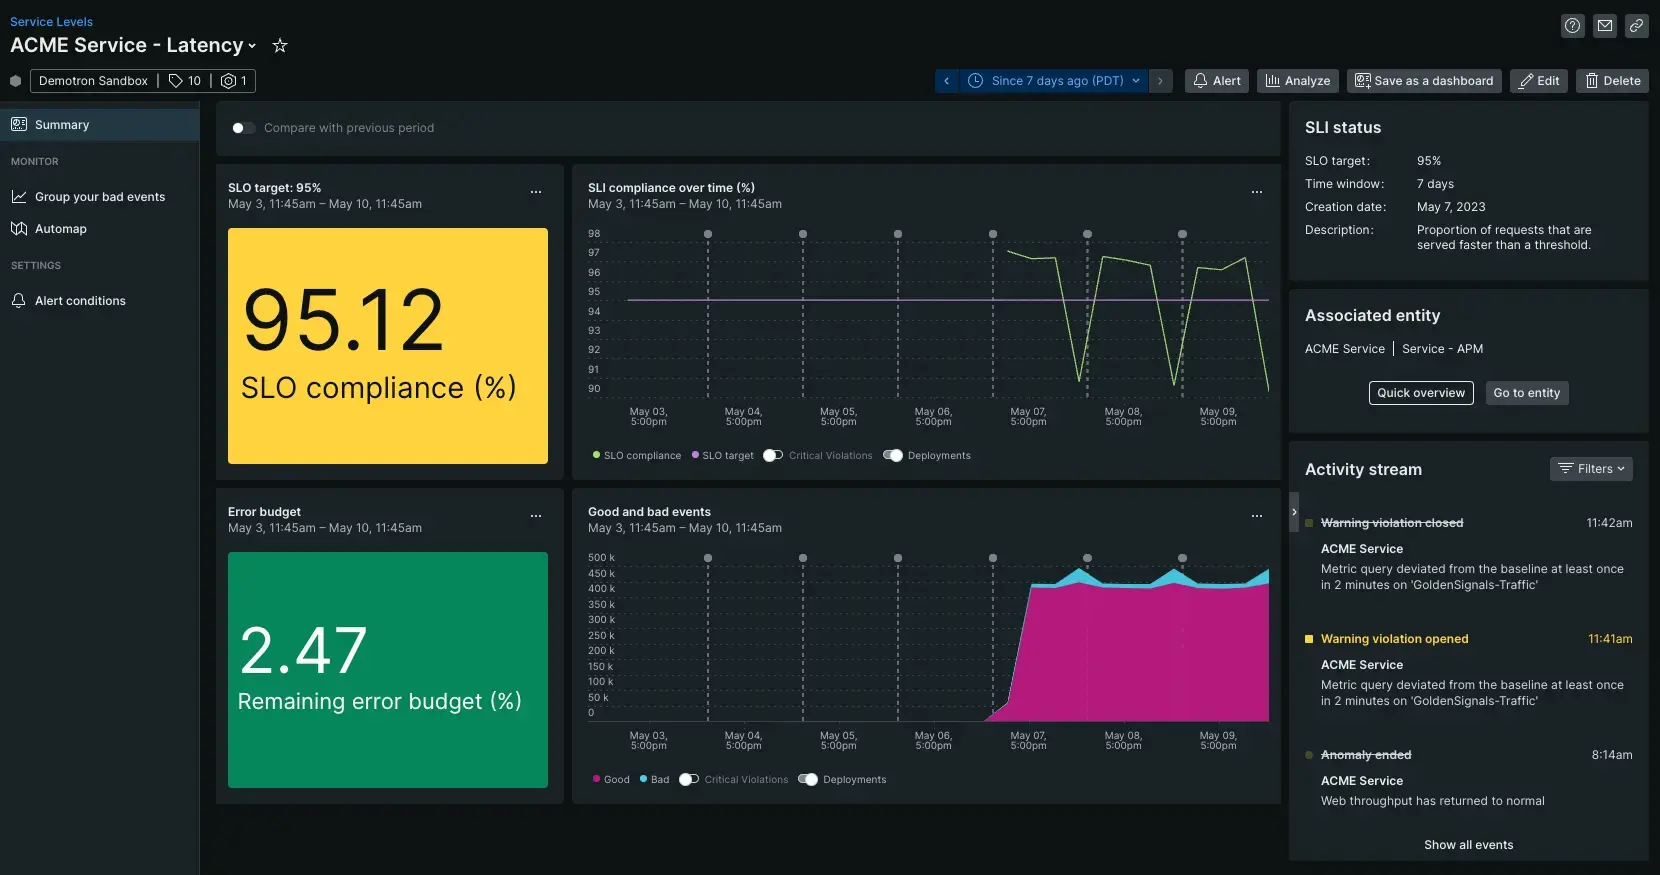
Our biggest recommendation for any team going into an event is to set up service levels. With service levels, you can take discrete system components and extract valuable business data about your gameday. While a team is thinking in terms of hosts, services, and apps, service level asks that you break down those entities into their requisite parts.
Objectives
In this tutorial, you will:
- Query New Relic to determine your baselines
- Create baseline-informed service levels
Identify your priorities
If you usually think in terms hosts, apps, and services, finding your priorities can be tricky, and the whole point of capacity planning is prioritizing the right things. We recommend evaluating how customers interact with your app, then identifying capabilities that power those customer touchpoints.
Here's an example user journey from our New Relic Acme Telco Home demo site:
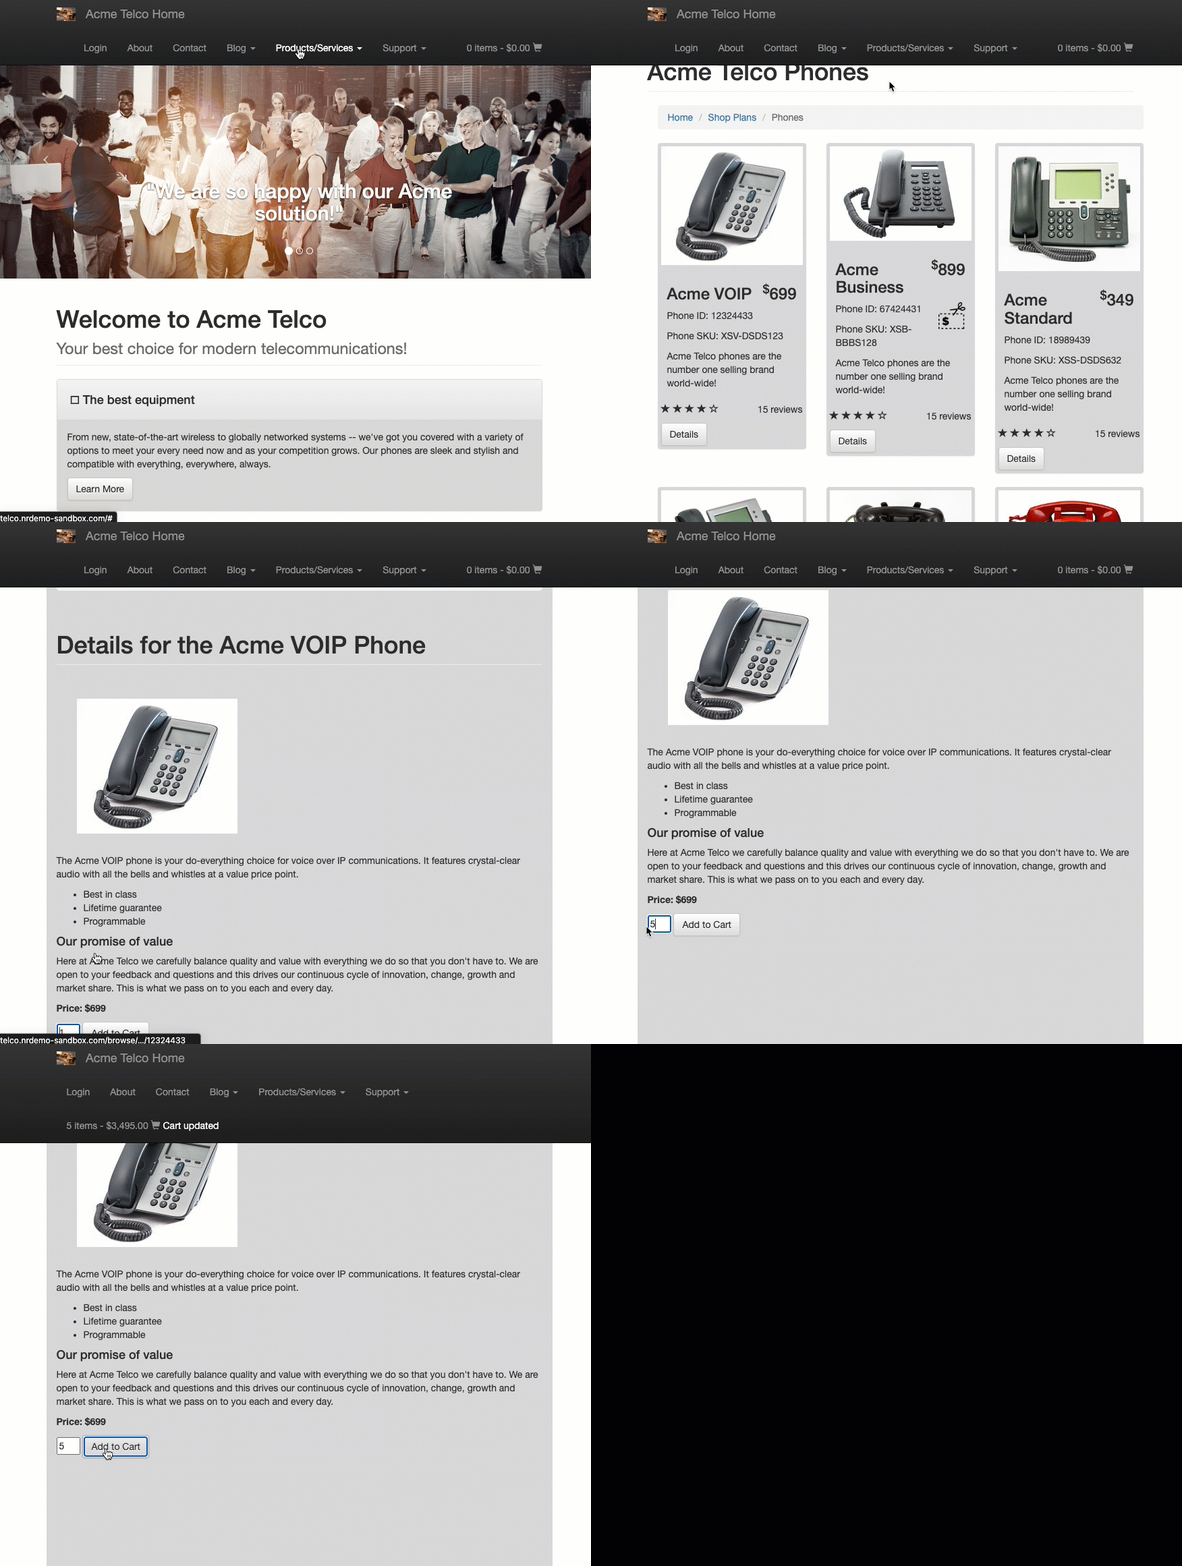
How many capabilities does this user touch? They navigate to a product list page, then select a product. Once they're on the product page, they scroll down, enter a quantity, and add the item to their cart. Each of these actions corresponds to a potential service level, which can be monitored on a peak demand day.
To help identify your own app's capabilities, we have some preliminary questions you might ask yourself about your architecture:
- What journeys do your customers most frequently go through?
- Of those journeys, which involve purchase transactions?
Once you've identified business-critical capabilities, you need to figure out what observability coverage they need. Where are the alert gaps in these journeys? Do they still need to be monitored?
By answering these questions, you can create a narrative about your system architecture that's informed by business needs. Data collected about an API call, click action, or transaction can be transformed into an indicator for business health.
Query for your baseline
After you've found what to prioritize, your next step is figure out how your app behaves on an ordinary day. Your app's ordinary behavior is a baseline, which is a kind of expectation. You can think of it like a cup of morning coffee: you have an expectation of what that coffee tastes like, so any difference in taste can indicate a problem with your machine.
Pull all popular transactions
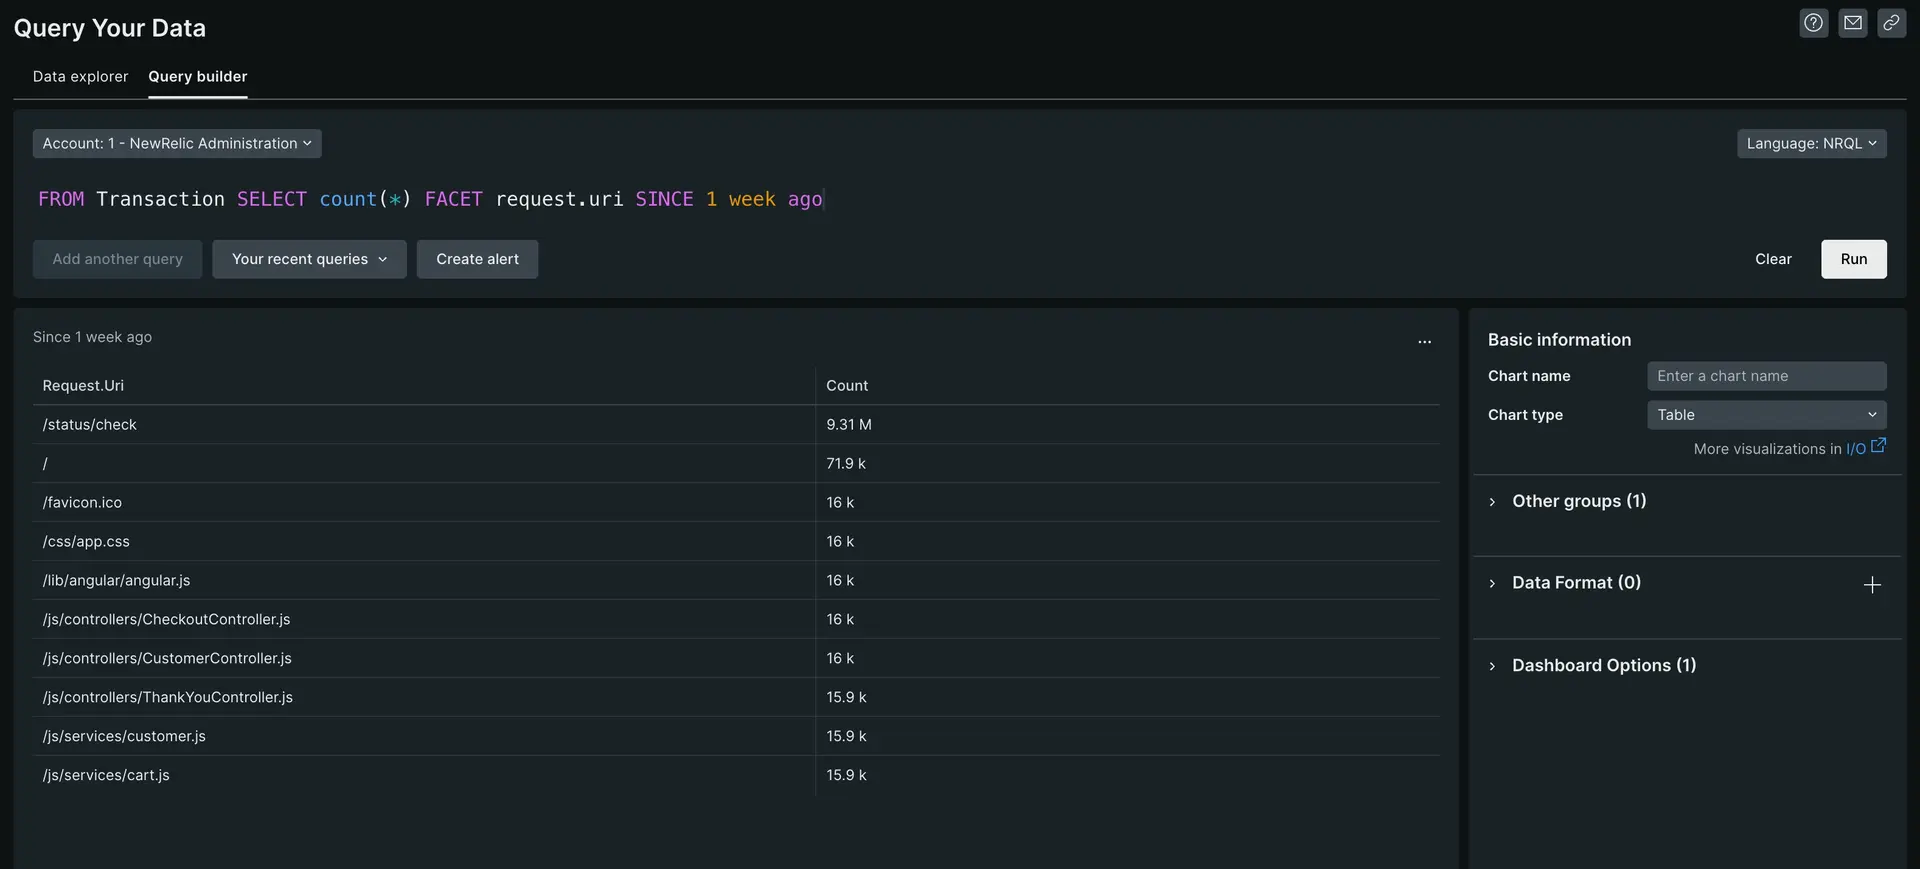
Go to one.newrelic.com > Query Your Data, then input the following query:
This query pulls all data about your app's transactions, then filters to only include transactions where a request is made to your app. From the table of request.uris, we see that /js/controllers/ is a popular request.uri. We'll work with this one.
Find latency baseline and success baseline
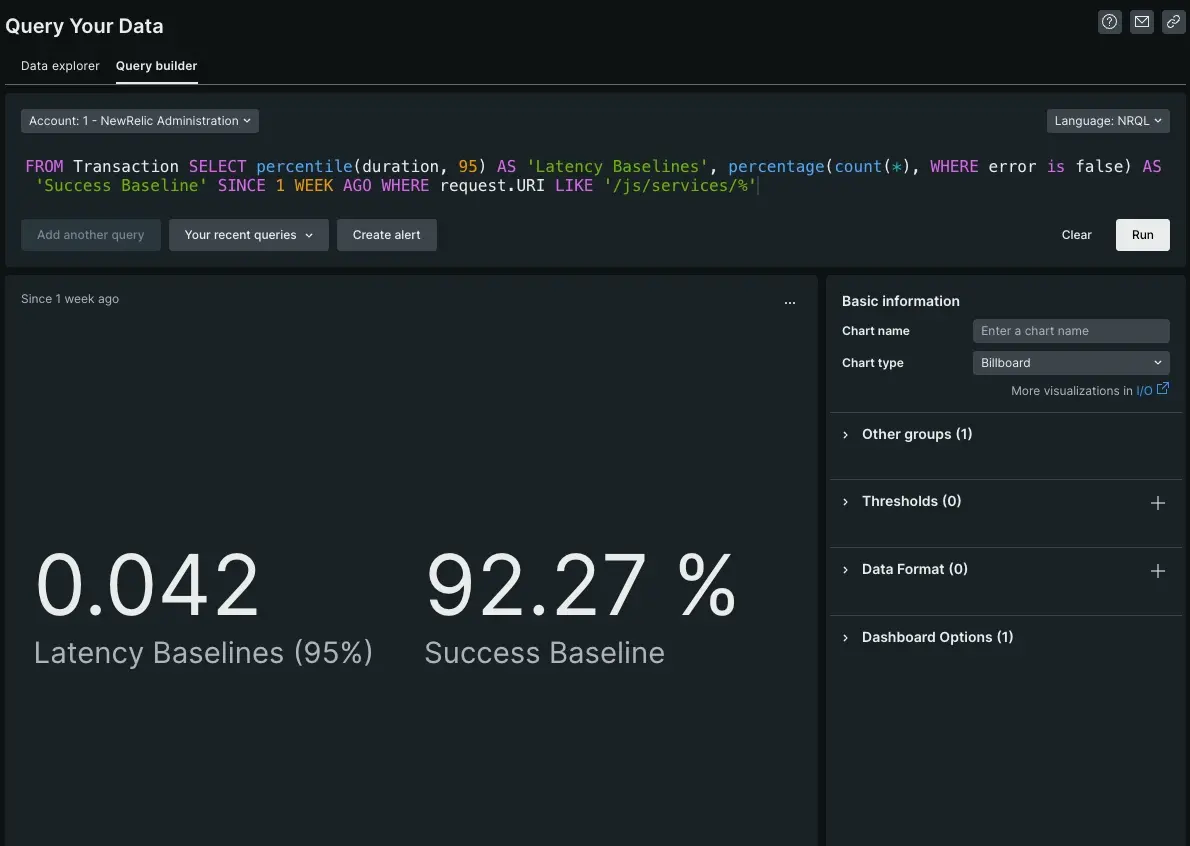
Focusing on /js/controllers/, update the above query to:
Remove the
FACETand focus the query on that particular URIReplace the total
count(*)withpercentile(duration, 95)FROM Transaction SELECT percentile(duration, 95) AS 'Latency Baselines', percentage(count(*), WHERE error is false) AS 'Success Baseline' SINCE 1 WEEK AGO WHERE request.URI LIKE '/js/services/%'This query tells us that the transaction typically responds in 42ms and has a 99.27% success rate. This is our latency baseline.
Create baseline-informed service levels
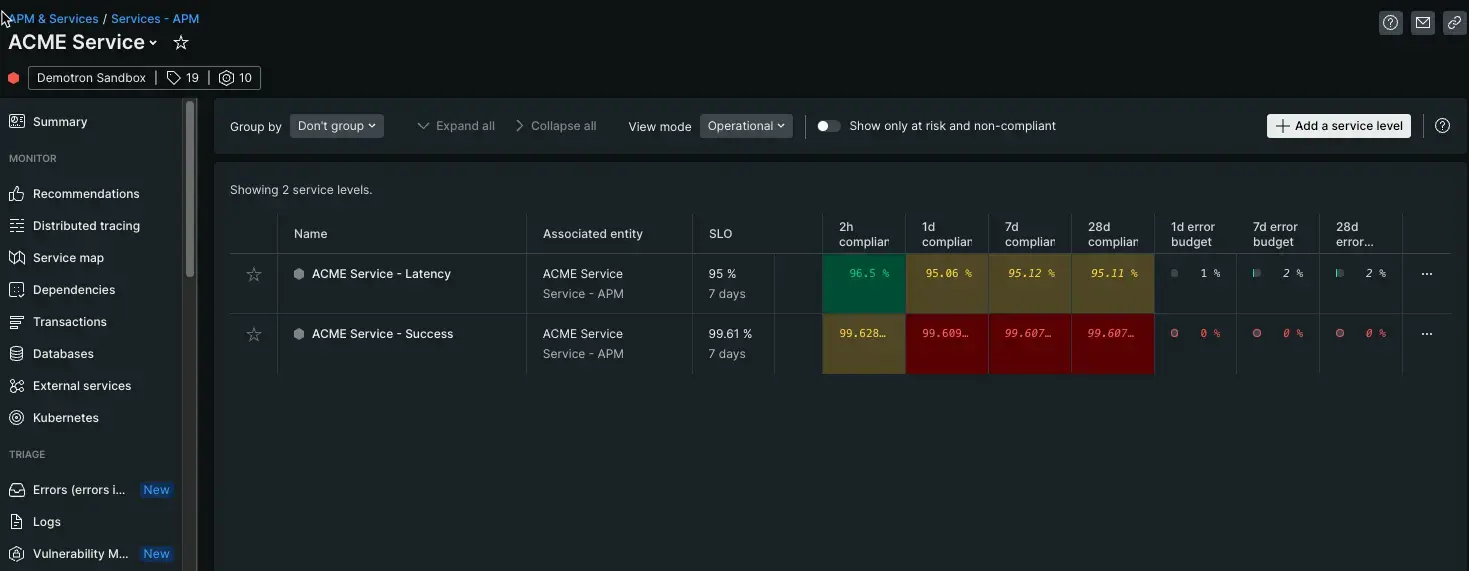
Now that you have some baselines, you can create a meaningful service level. From the Query Your Data page, head back to one.newrelic.com > APM & Services, then click Service levels located under Reports.
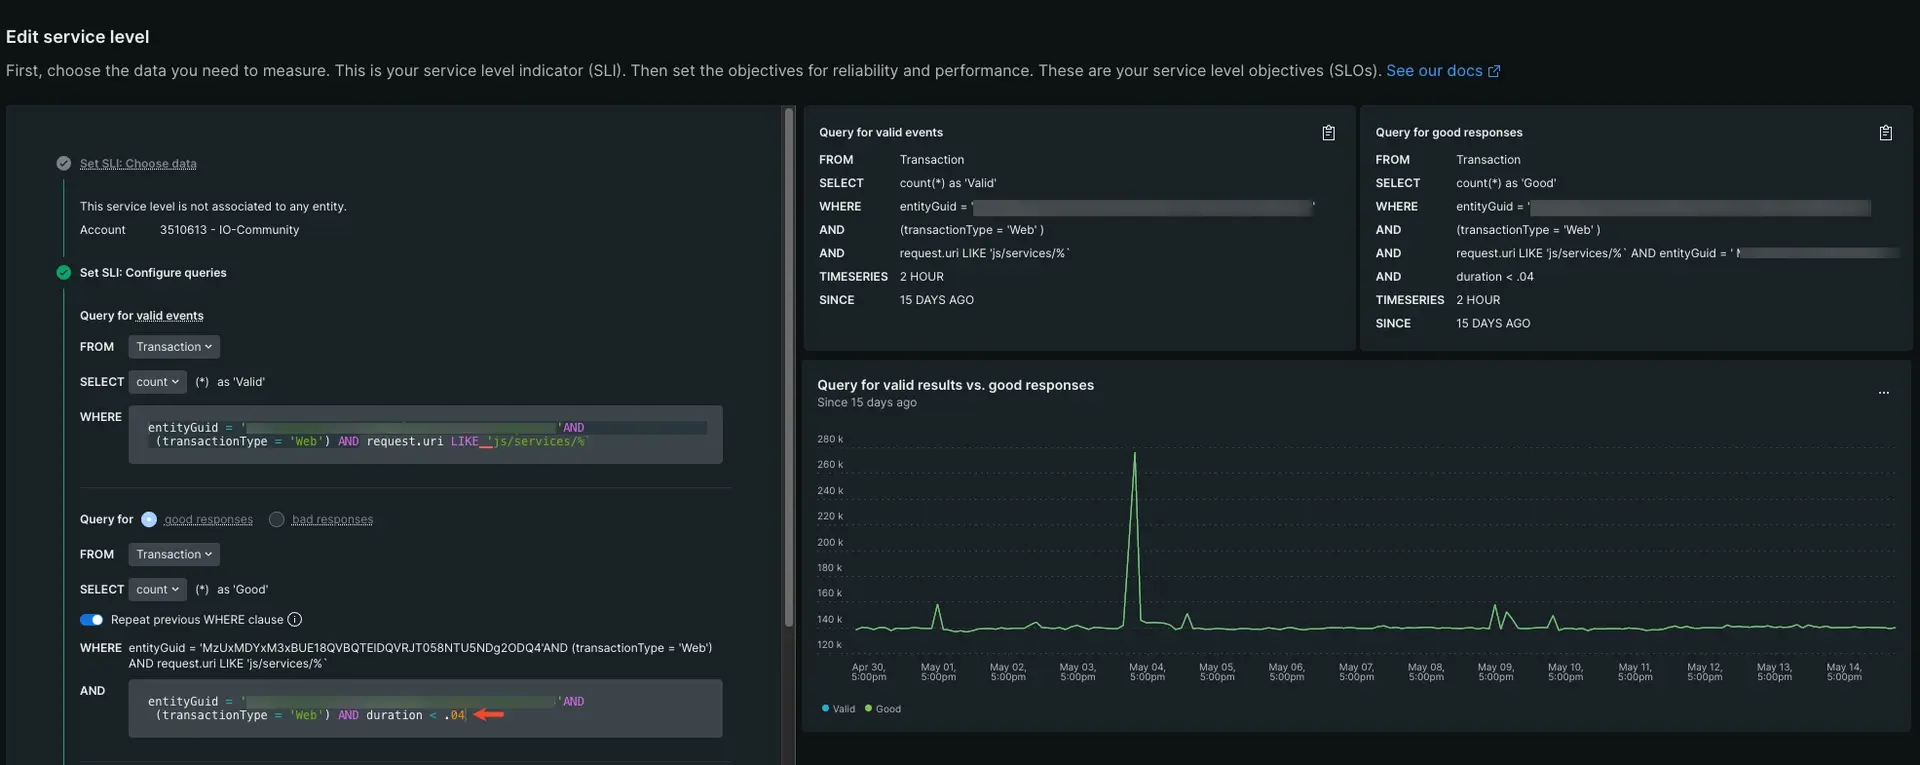
When you add a new service level, New Relic auto-populates a baseline average from every data source in your app. But we want to prioritize a specific baseline for a specific capability.
With the baseline we pulled from the previous section, we can edit the WHERE box. Add the following string to the end of the populated query so the line reads:
After you've updated the WHERE field, confirm that your duration in the AND field matches the time in miliseconds queried in step 2. In this case, the request gets a response in about 42(ms) and the AND field matches with a .4 duration.
