Think about what your service does. Perhaps it receives an order, needs to validate the order for integrity, conveys that order to a clearinghouse service, and receives a confirmation code that's relayed back to the requestor. This example gives a clear path to break down the function of service and evaluate if you have enough telemetry and context to make decisions on how the service is functioning. If you are using New Relic's agents, you should have all the information you need to answer the questions at the beginning of this section. However, sometimes specific implementations require additional instrumentation.
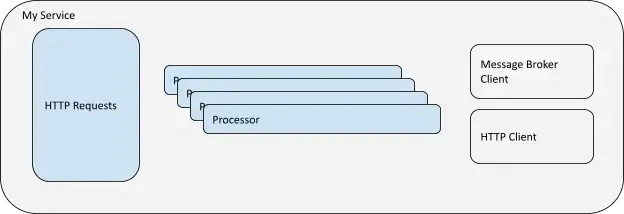
The following list of questions helps you find where you might need to add telemetry or metadata capture through instrumentation. The improvement process section that follows describes how to get the data needed to manage your service.
Considerations for instrumentation:
Are my base telemetry requirements satisfied? | If not, document the gaps and evaluate if they can be closed through custom configuration or additional instrumentation techniques. |
Can I isolate discrete user stories within the telemetry? | If not, use trace capabilities of agents to capture the invocation of a discrete user story with adequate context metadata. |
Do I have insight into the parameters that are invoking user stories? | If not, use custom attributes through agent SDKs to add context to the transactions and spans. |
Can I measure the major functional components of the software? | If not, use instrumentation SDKs to create baseline metrics on a specific functional element of the code. (cache lookups, processing routines, or utility functions). |
Can I measure the client interactions from my code to external systems? | If not, ensure requests and responses are captured by component level tracking. If the client invocation is not in synch, consider implementing distributed trace features to correctly view the processing. |
Determine your instrumentation needs
First, you'll need to determine specifically what you need to do. Every service fulfilling a business need should have enough instrumentation to answer the following questions, and now is a good time to sew which ones you can and can't answer so you can know what areas you need to focus on.
- How many requests do I receive?
- How many messages and HTTP requests do I send?
- How many requests are successful?
- What is the response time for a full request?
- What is the response time for invocation to a dependency?
- How much resource should this process take under what number of requests?
- What are all my points of failure?
Configure your instrumentation
Next, it's time to begin configuring your instrumentation. Each New Relic agent provides a variety of configuration options. Typically you'll define a standard approach to include the agents within infrastructure hosts, application runtimes, and connections to your cloud service providers. Default agent configurations have been created to be widely applicable.
One of the best ways for developers to influence the applicability of deployment is by overriding the default configuration options for your service instance. The following are default instrumentation options to consider:
Override default agent configuration
Sugerencia
The New Relic agents provide a variety of options for runtime configuration. Please refer to the APM agent config docs for the options specific to your runtime.
Each New Relic APM agent provides a variety of options to modify the default configuration. The most consistent location we do this is the configuration file that accompanies each agent install. However, you can also configure our agents by passing command line parameters directly to the service instance runtime, by using environment variables, or by calling functions within the agent's SDK at runtime.
Here are the .NET agent configuration options:
Isolate service functions
As the Create an effective service name section indicated, one of the primary objectives of instrumentation is to configure the New Relic agent to group similar runtime constraints together as a single named unit. For a specific set of inputs, you should get an expected range of measurable outcomes. The degree to which we can comfortably contain these into named service runtime components greatly helps us understand normal behavior and isolate issues.
The New Relic agent is configured with a set of assumptions that create namespaces for transactions as they're detected. Those assumptions differ between the agent language runtime. A good example of how our Java agent determines the transaction name can be found in the Java agent's transaction naming doc.
However, even after you've applied the agent transaction naming protocol, it may give you an unsatisfactory result depending on your needs. By adding additional instrumentation to name the transaction and improve its context, you can greatly improve your understanding of the service's execution behavior.
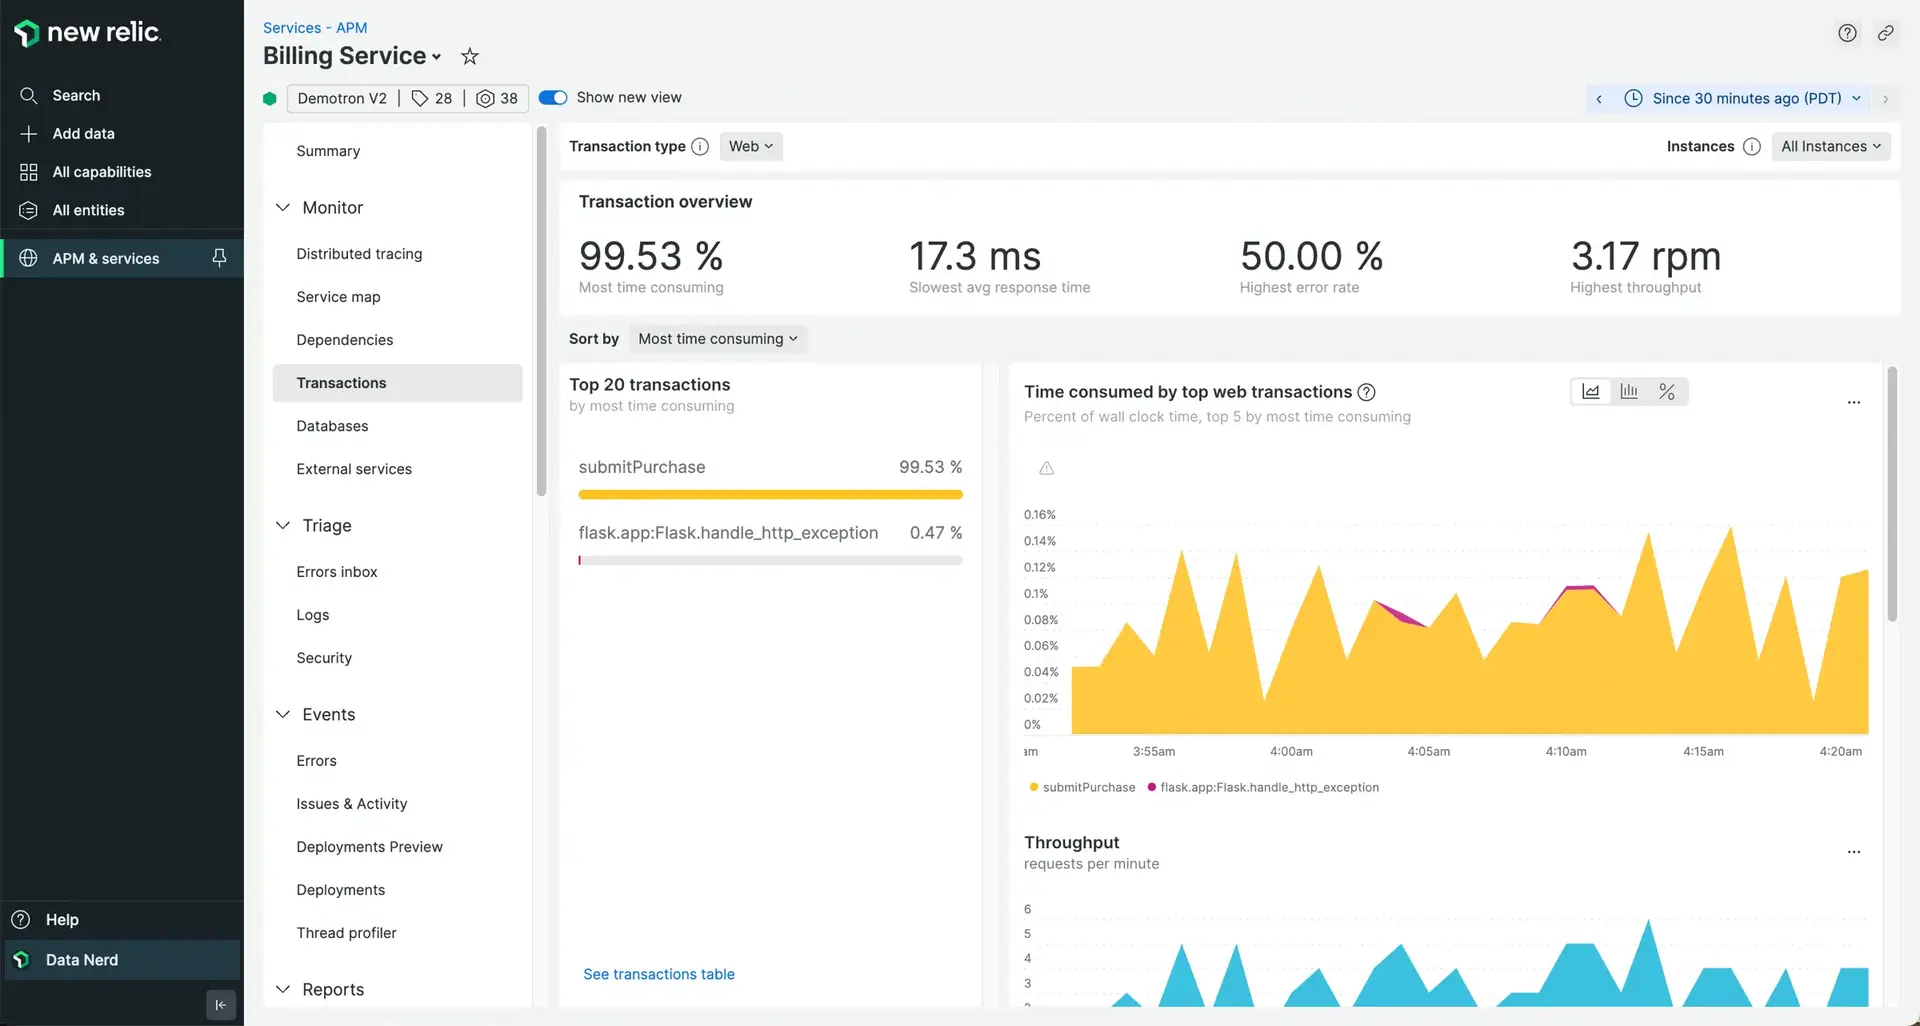
The goal for transaction naming should be a view of APM transactions that provides good segmentation of the services functions in an approach that's easy to understand for a non-developer. The transaction breakdown image above is a good example of transaction segmentation. It provides detailed tracking of the amount of work being done by each transaction within the broader codebase of the service as well as the transaction with a plain user-friendly name that offers insight into what the transaction does. As you learn more about naming transactions and including attributes, be sure to make your naming approach accessible for non-technical observers of the data.
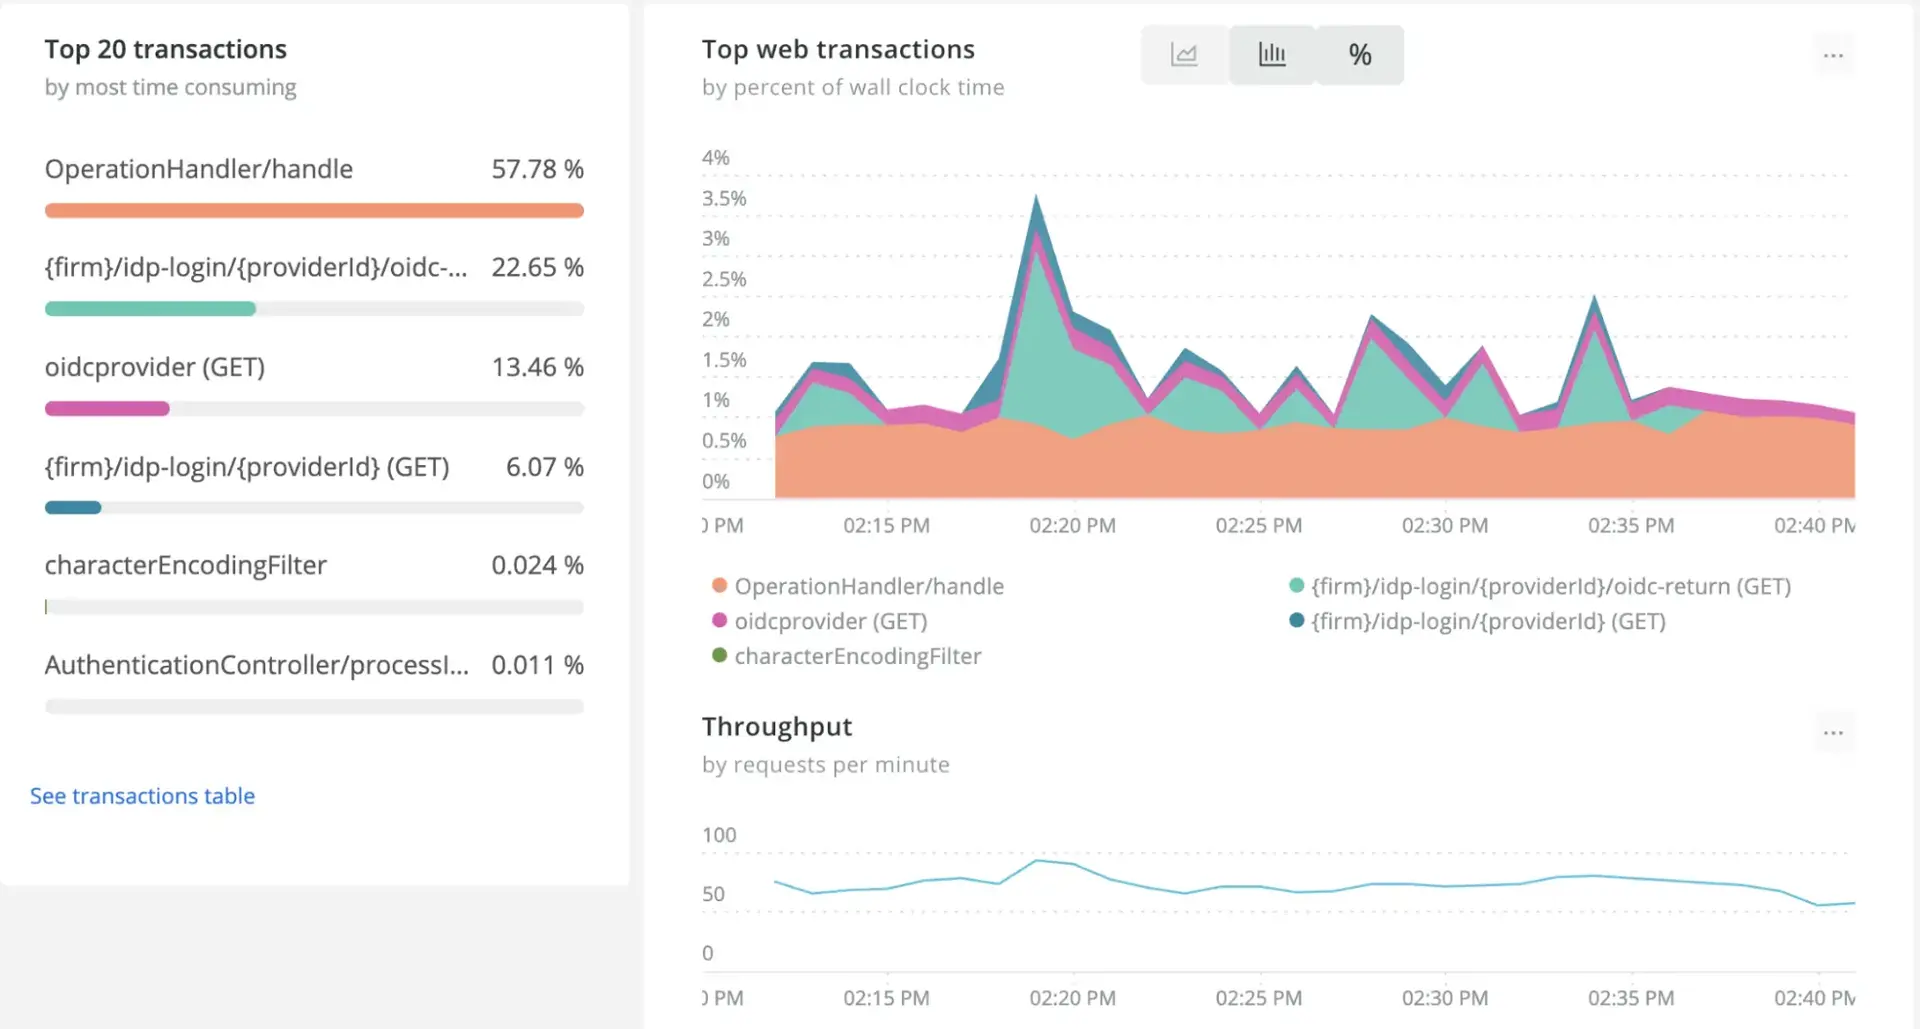
The transaction breakdown in the image above demonstrates a bad example of transaction name segmentation. In this case, you'd have about 60% of the transaction volume being named OperationHandler/handle. Both the percentage attribution of the transaction volume and the generic nature of the name indicate there might be too much aggregation of transactions underneath that namespace.
Your objective is to create a transaction name that facilitates grouping transactions with the fewest unique characteristics, such as below.
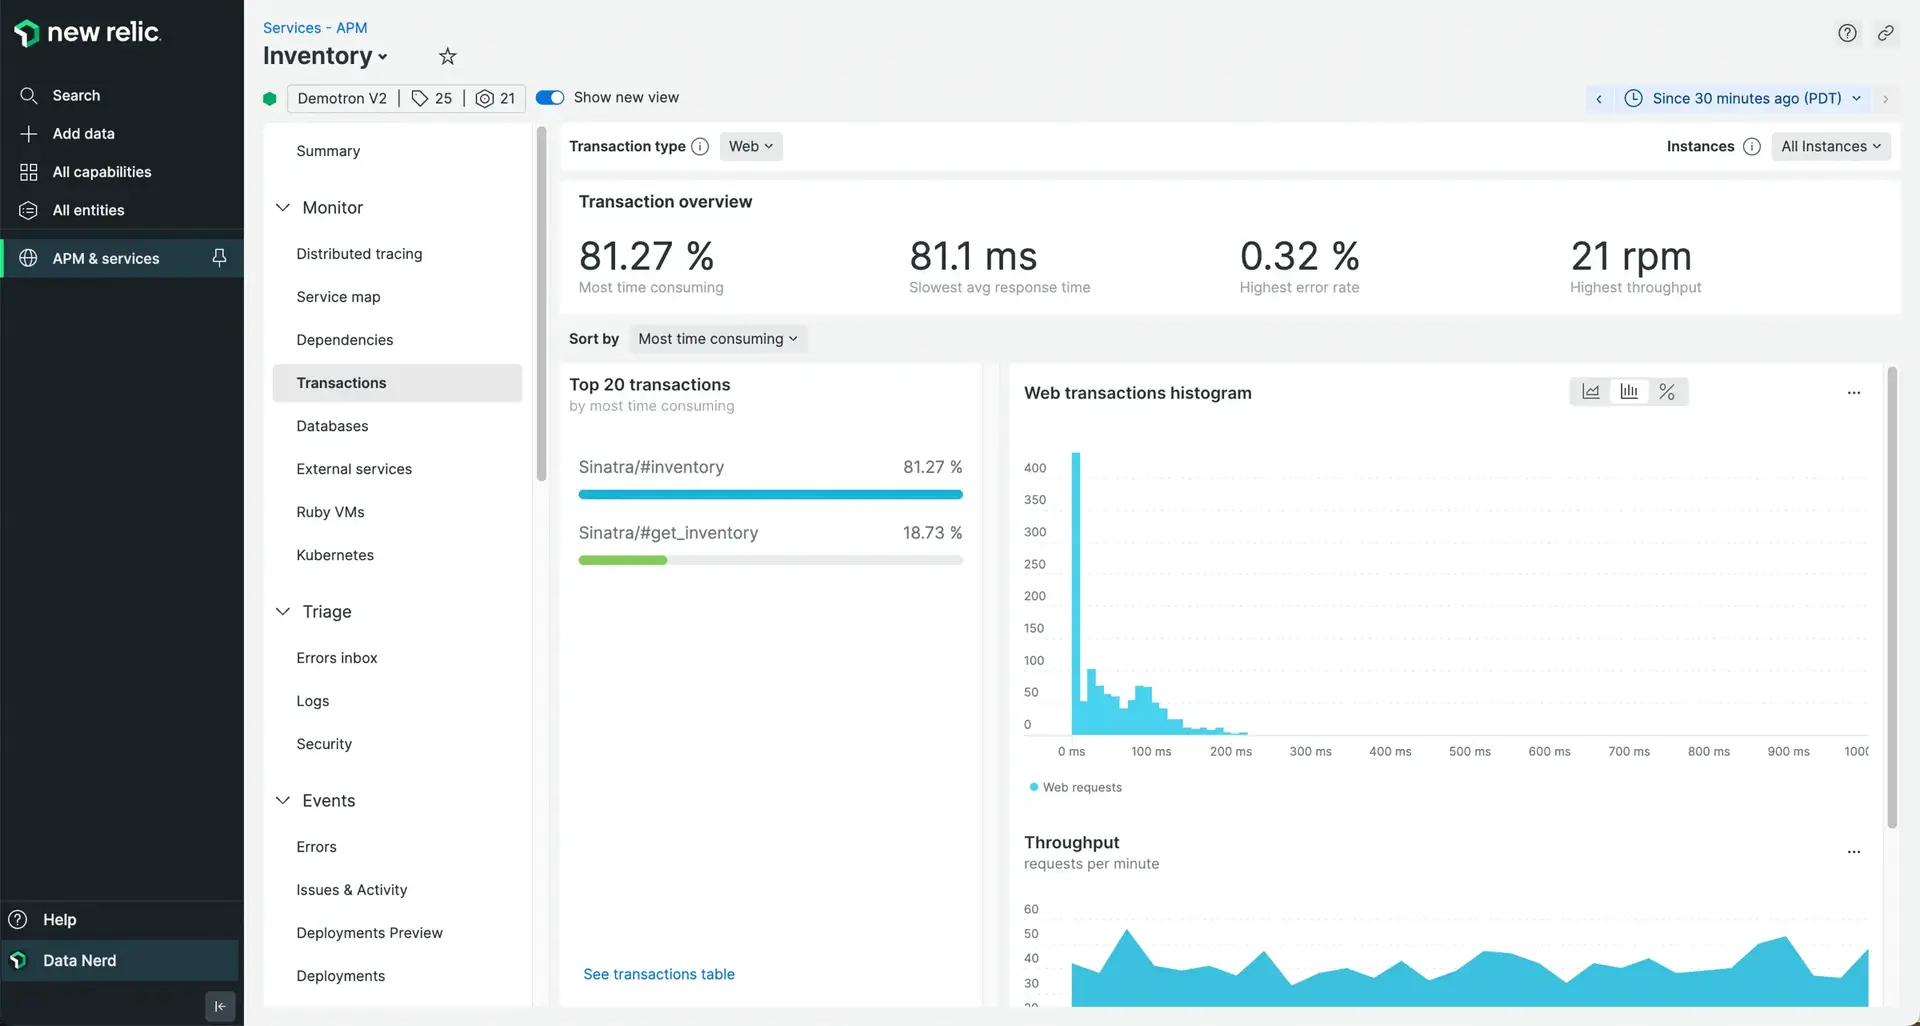
The normal distribution image demonstrates more purposefully named transactions within a service. In this case, the web transaction response times are more closely grouped, indicating consistent execution characteristics.
Define custom transaction names
Sugerencia
Consult the API guide for your New Relic agent to review the transaction naming procedure for your runtime.
The New Relic agent transaction naming service requires the invocation of a SetName(String name)-like API call to the New Relic agent SDK. Each language runtime agent has its own syntax and option for setting the name. See the example below if you need more information:
There is a maximum capacity for transaction names. When too many transaction names are being reported, we'll attempt to create rules to group those transaction names. More details can be found in the agent troubleshooting guide related to metric grouping issues. Your transaction naming strategy will have to trade off a degree of specificity if there are thousands of potential transaction names.
Should you suspect a metric grouping issue, open a support case with us and we'll be happy to work with you to isolate the cause of the transaction naming issue.
Capture parameters with your transactions
Sugerencia
Consult the New Relic agent custom attributes guide for your agent language to review the metadata enhancement options for attribute customization.
The transaction name is a powerful way for you to segment your service so that you can better understand its behavior. It allows you to discretely isolate functionality directly in the New Relic UI.
However, there are many occasions when you'll want to get some additional context on the function of your service without resorting to isolating the transaction name. This can be accomplished by introducing attribute capture by your service.
You can add name:value pair attributes to decorate the details of each transaction. The attributes will be available in each transaction event through the APM transaction trace and errors UI, or through direct query of parameters from the Transaction event type. Here's an example of the transaction trace details you can see in the APM errors UI.
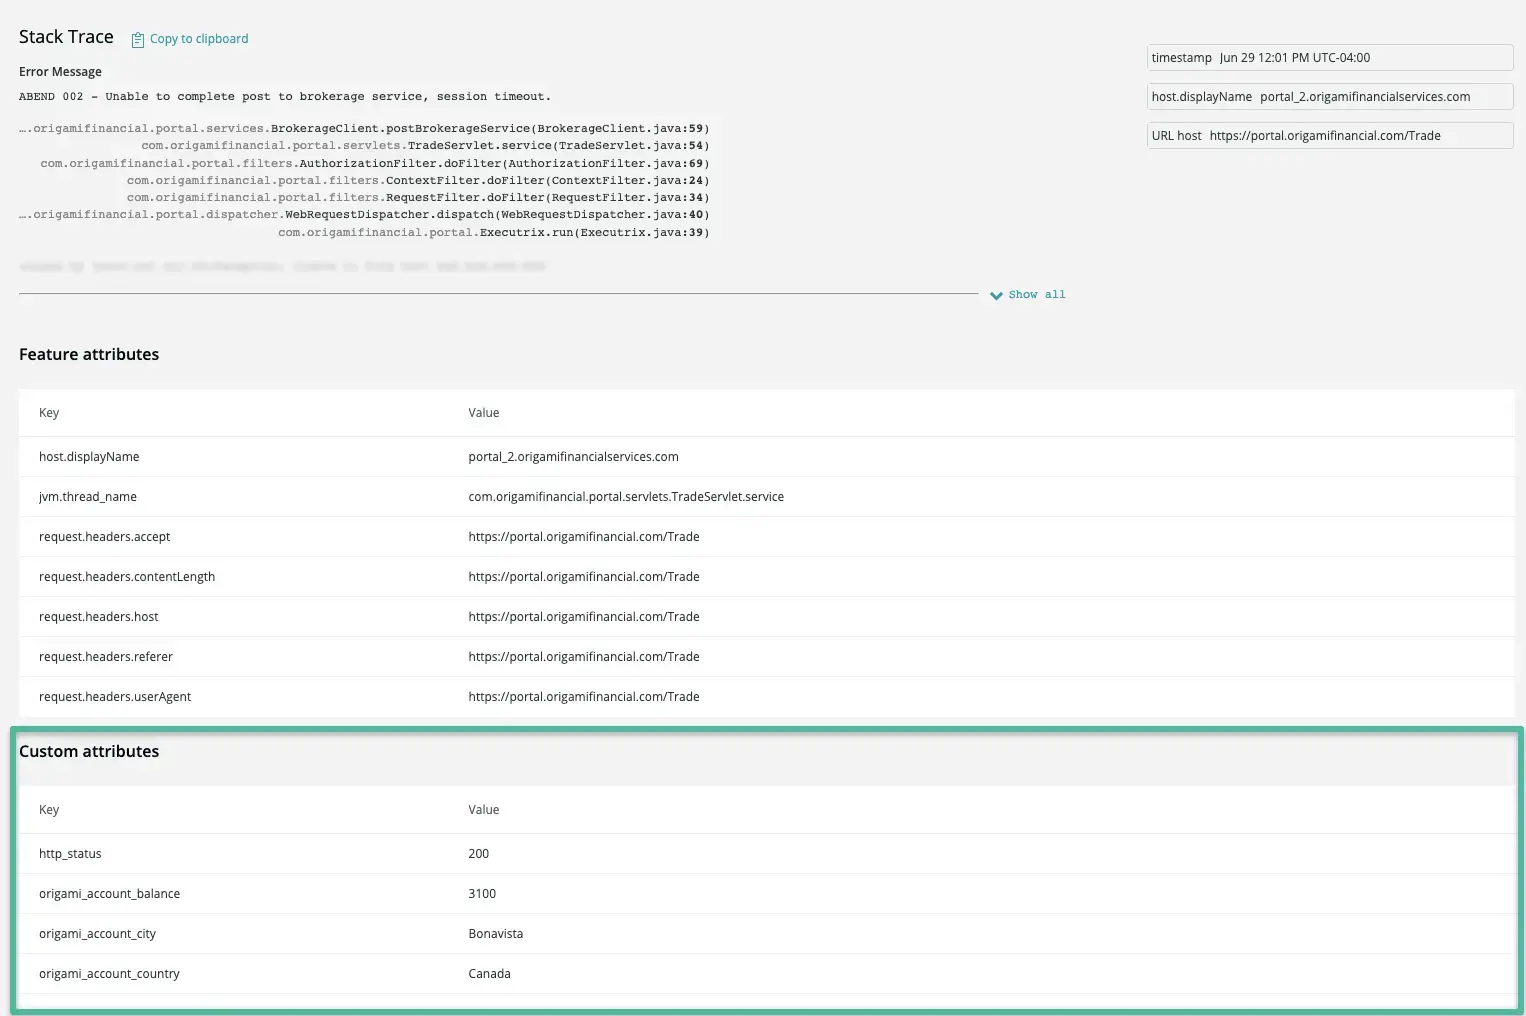
If you've developed a useful transaction name segmentation, you can use the added context of the attributes to better understand the inputs, cohorts, or segments that led to an unexpected result.
In addition to being able to understand the context of your transaction within the APM UI, using parameters are useful for analyzing transactions by querying transaction data directly. Add custom attributes to each transaction to make it easy to isolate specific conditions.
The parameter capture approach can also be used with feature flag systems like Split or LaunchDarkly. In this case, as you're implementing the decision handler for the feature flag, consider capturing the flag context (for example, optimized_version = on) that's being applied to the block of code controlling the version or feature the customer sees.
For example, to take the value of an HTTP request parameter and save it as a custom attribute with the New Relic Java agent, you can use code similar to this:
com.newrelic.agent.Agent.LOG.finer("[my query handler] Adding an Attribute to transaction based on an important query parameter");
com.newrelic.api.agent.NewRelic.addCustomParameter("ImportantParm", (javax.servlet.http.HttpServletRequest)_servletrequest_0).getParameter("important_query_parm"));Measure service components
The behavior of a specific transaction within the context of a service is a powerful way to ensure a software system is operating effectively. However, another way to look at the behavior of a software system is to review the detailed component execution model of its implementation. The application framework code components are shared throughout the service, and the ongoing evaluation of component performance can provide an insight into the overall service health.
In New Relic, there are two places you can observe component execution details. The service summary dashboard in APM provides a view of the composite execution of the service broken down by its component parts (for example, garbage collection execution or database calls).
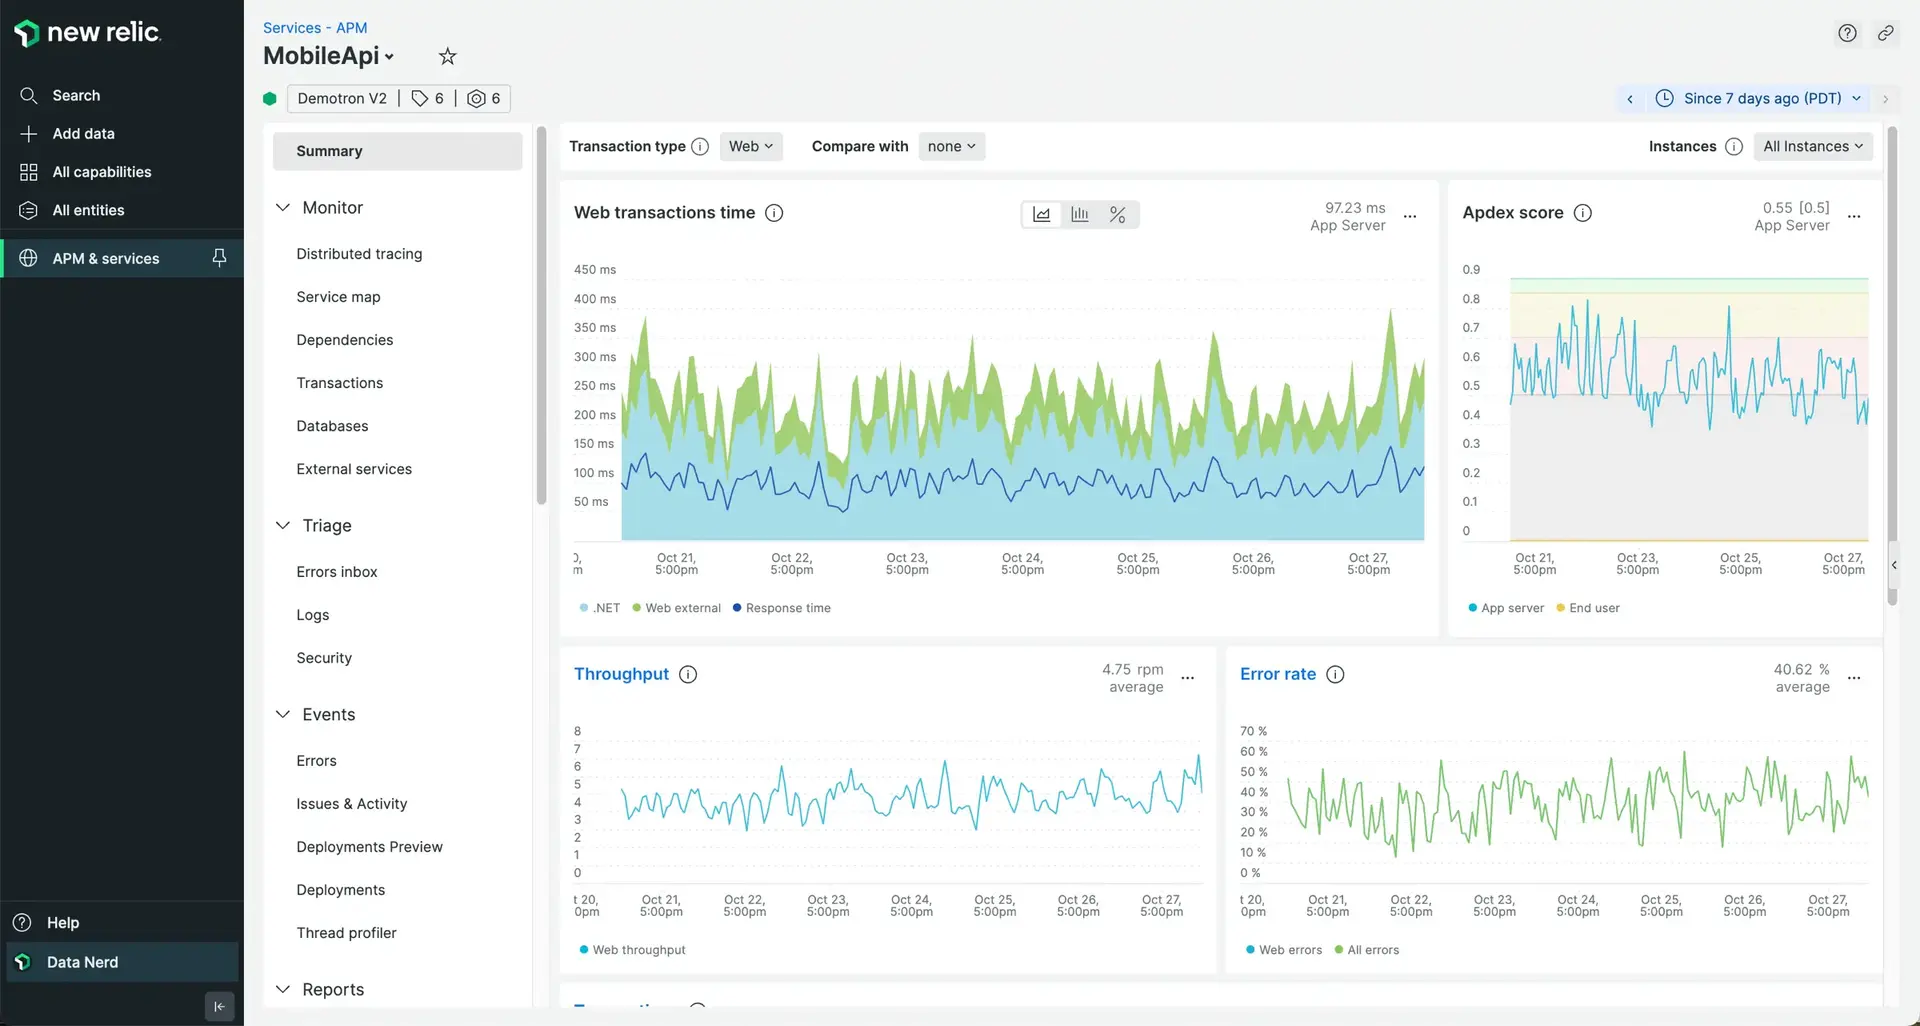
Transaction component segments tend to demonstrate consistent performance behavior. You can use this to detect a change in fundamental behavior. This can indicate an underlying issue. This allows you to find dependencies through the common parts in the code running within a service.
Ensure your frameworks are measured
Sugerencia
To find information about adding metric names to your instrumentation, consult the instrumentation and SDK guides for a specific APM agent.
The syntax for framework instrumentation is specific to the language your service is written in, but the general approach is consistent across them all. Each method or function execution on the stack is an opportunity to add additional instrumentation.
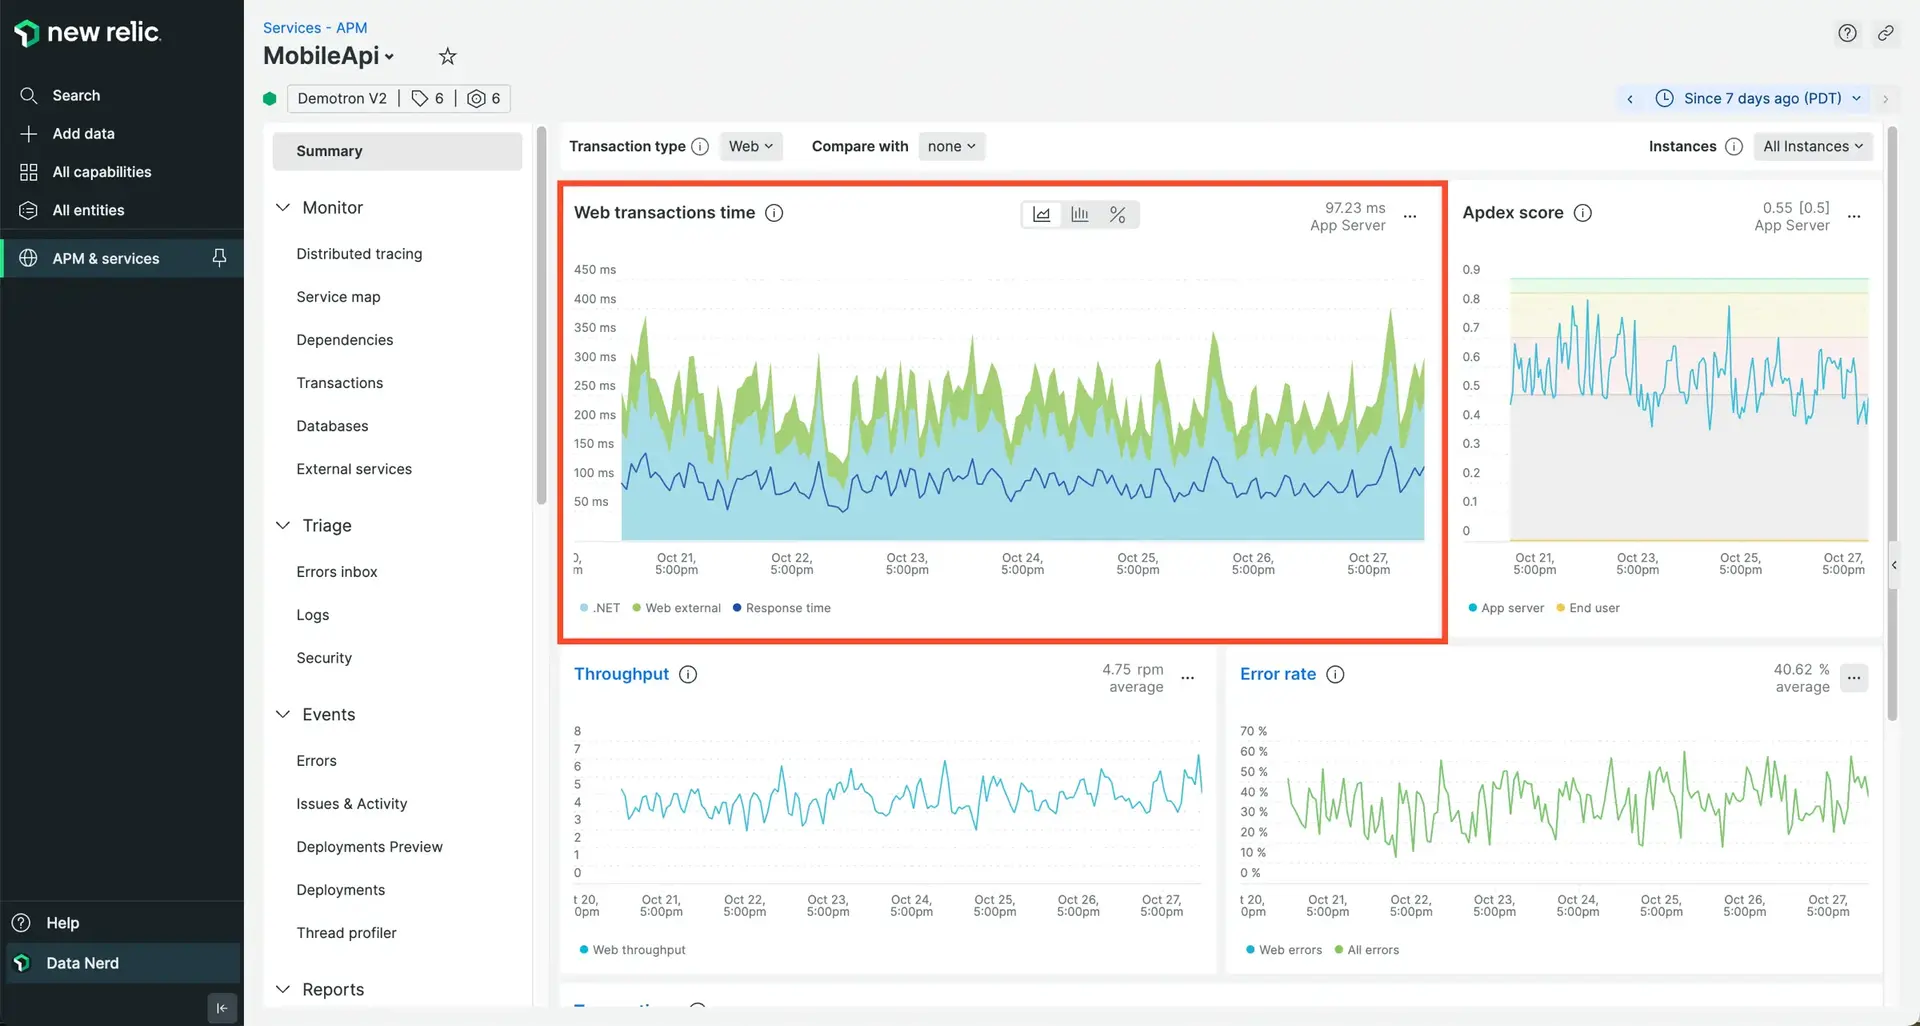
If a particular segment of logic is required for the function of your service or transaction, consider wrapping that call with callbacks to the New Relic agent so that the agent can understand that it has entered a discrete code component and can aggregate the time consumed within that component accordingly. By passing a metric name to the callback, you will create a component segment metric for your service and transaction.
The metric naming option is specific to the instrumentation language, so be sure to consult the specific language documentation.
Our agents allow you to specify a custom metric name for the instrumentation. We use metricName to determine the aggregated metric for the component. The following example demonstrates the metricName parameter being passed to a Java agent SDK @Trace annotation.
Track your external service calls
Sugerencia
To find the details of client library instrumentation, consult the instrumentation and SDK guides for the relevant APM agent.
Client instrumentation refers to making a call from your service to an external resource. Generally, New Relic agents are aware of clients popular for HTTP, gRPC, messaging, and database protocols and will apply the appropriate instrumentation pattern to aggregate calls to those clients as external services.
If you have written your own client handler for a protocol, or are using something very new, our agent may not recognize the client and record the behavior of the client call. To this end you should verify the external services and databases within APM to represent all expected externalities for your service.
It's important to validate that all your services' dependencies are represented here. If you don't see your service dependencies, you'll need to introduce new instrumentation to intercept the external call so that your APM agent can track it. The following example demonstrates wrapping an external call in Golang for capture by the agent.
Examples of other agent API external call tracing:
Test your endpoints
Endpoint testing provides two benefits to your service instrumentation program:
Defect detection: By encoding a test for an endpoint that produces a simple true/false result, your operations can isolate discrete failures to determine if the integrity of service delivery has been compromised.
Baselining: Synthetic or machine tests provide a predictable set of conditions that allow you to evaluate the consistency of your service delivery from a control perspective.
Our synthetic monitoring offers the ability to create a variety of testing types by employing an enhanced Selenium JavaScript SDK. Once a Selenium-based test script has been defined, we'll manage the location of the script execution as well as its frequency. The synthetic test offers a variety of test options, each with its own focus. For more information see our synthetic monitoring documentation.
First, you'll need to create a decision matrix for synthetic checks. Knowing whether or not you need to create a synthetic check is straightforward. You'll want to know the first occurrence of a failure for a dependency. If you answer “yes” to any of the following questions, consider creating a dedicated synthetic check:
Is the endpoint customer-facing?
Does the endpoint invoke new dependencies?
Is the endpoint on a different network infrastructure?
Is the endpoint shared between multiple services?
Is the endpoint a content origin supported by a CDN?
You should then consider implementing the simplest possible test to evaluate endpoint availability and integrity. For example, you have just created a new Service endpoint that provides the current exchange rate for a group of currencies. This is a simple GET at an endpoint that returns a JSON object array.
Request example:
http://example-ip:3000/exchangeResponse example:
[{"status": ["quote"],"_id": "5b9bf97f61c22f4fb5beb5c9","name": "cdn","Created_date": "2021-07-12T18:10:07.488Z","__v": 1},{"status": ["quote"],"_id": "5b9bfb2a61c22f4fb5beb5ca","name": "usd","Created_date": "2021-07-12T18:17:14.224Z","__v": 0.80},{"status": ["quote"],"_id": "5b9bfb3261c22f4fb5beb5cb","name": "eur","Created_date": "2021-07-12T18:17:22.476Z","__v": 0.68},{"status": ["quote"],"_id": "5b9bfb3761c22f4fb5beb5cc","name": "mex","Created_date": "2021-07-12T18:17:27.009Z","__v": 15.97}]In order for this service to be considered operational, it needs to respond to requests but also provide the four currency responses. We're not worried about the content at the moment, just the fact we get four elements back in the array one, for each CDN, USD, EUR and MEX currencies.
Using New Relic synthetic monitoring, an API test script could look like the following:
/*** This script checks to see if we get the currency data from the endpoint.*/var assert = require('assert');var myQueryKey = 'secret_key';var options = {uri: 'http://example_ip:3000/exchange',headers: {'X-Query-Key': myQueryKey,'Accept': 'application/json'}};function callback (err, response, body){var data = JSON.parse(body);var info = body;if (Array.isArray(data)) {if (data.length !== 4) {assert.fail('Unexpected results in API Call, result was ' + JSON.stringify(data));}}}$http.get(options, callback);You can directly configure the synthetics script in the New Relic interface, but we highly recommend you maintain your endpoint tests within your source repository system and employ automation. This ensures your endpoint testing accompanies the new endpoint dependencies that your services introduce to production service delivery.
Realizing the value
Like the process of monitoring services, your observability program will benefit through a dedicated team function that thinks critically about its expectations of return for its investment in effort. The following section outlines an approach for estimating the costs and benefits you should expect by incorporating service instrumentation into your observability practice.