Automatically detect browser logs
Auto logging collects log messages issued from the browser console to help you maximize observability of your front-end applications.
Browser logs are tracked by default at the WARN level for Pro and Pro+SPA agents, but unavailable for the Lite browser agent. We recommend that you first confirm you're using the Pro or Pro + SPA browser agent.
Important
Certain settings, such as enabling or disabling browser log collection and adjusting sample rates or log verbosity, are server-side configurations. Once you add the agent snippet to your pages, you don't need to redeploy the script to change these settings. However, server-side configurations have no effect if the feature aren't included in the deployed script. This applies to browser agent version 1.259.0 or later.
How browser auto-logging works
Based on logging levels and sampling rates set in the configuration, auto-instrumentation of browser logs will attempt to collect messages from the following methods:
Method | Level |
|---|---|
console.log |
|
console.error |
|
console.warn |
|
console.info |
|
console.debug |
|
console.trace |
|
By default, logging data is stored for 30 days, but actual data retention depends on your account.
Prerequisites
A Pro or Pro + SPA browser agent:
Agent version
Configuration behavior
1.283.0 - 1.305.0Application settings are applied to both console and manual logs
1.306.0and aboveConsole logs and manual logs have separate settings for verbosity, sampling, and enable/disable controls
Important
Automatic log detection is not available for the Lite browser agent.
Enable automatic log collection (For existing browser apps)
Enhance your application's observability and debugging capabilities by following these simple setup instructions.
Go to one.newrelic.com > All Capabilities > Browser.
Select your browser app.
In the left-hand menu, click Application settings.
Ensure the Pro or Pro + SPA browser agent is selected.
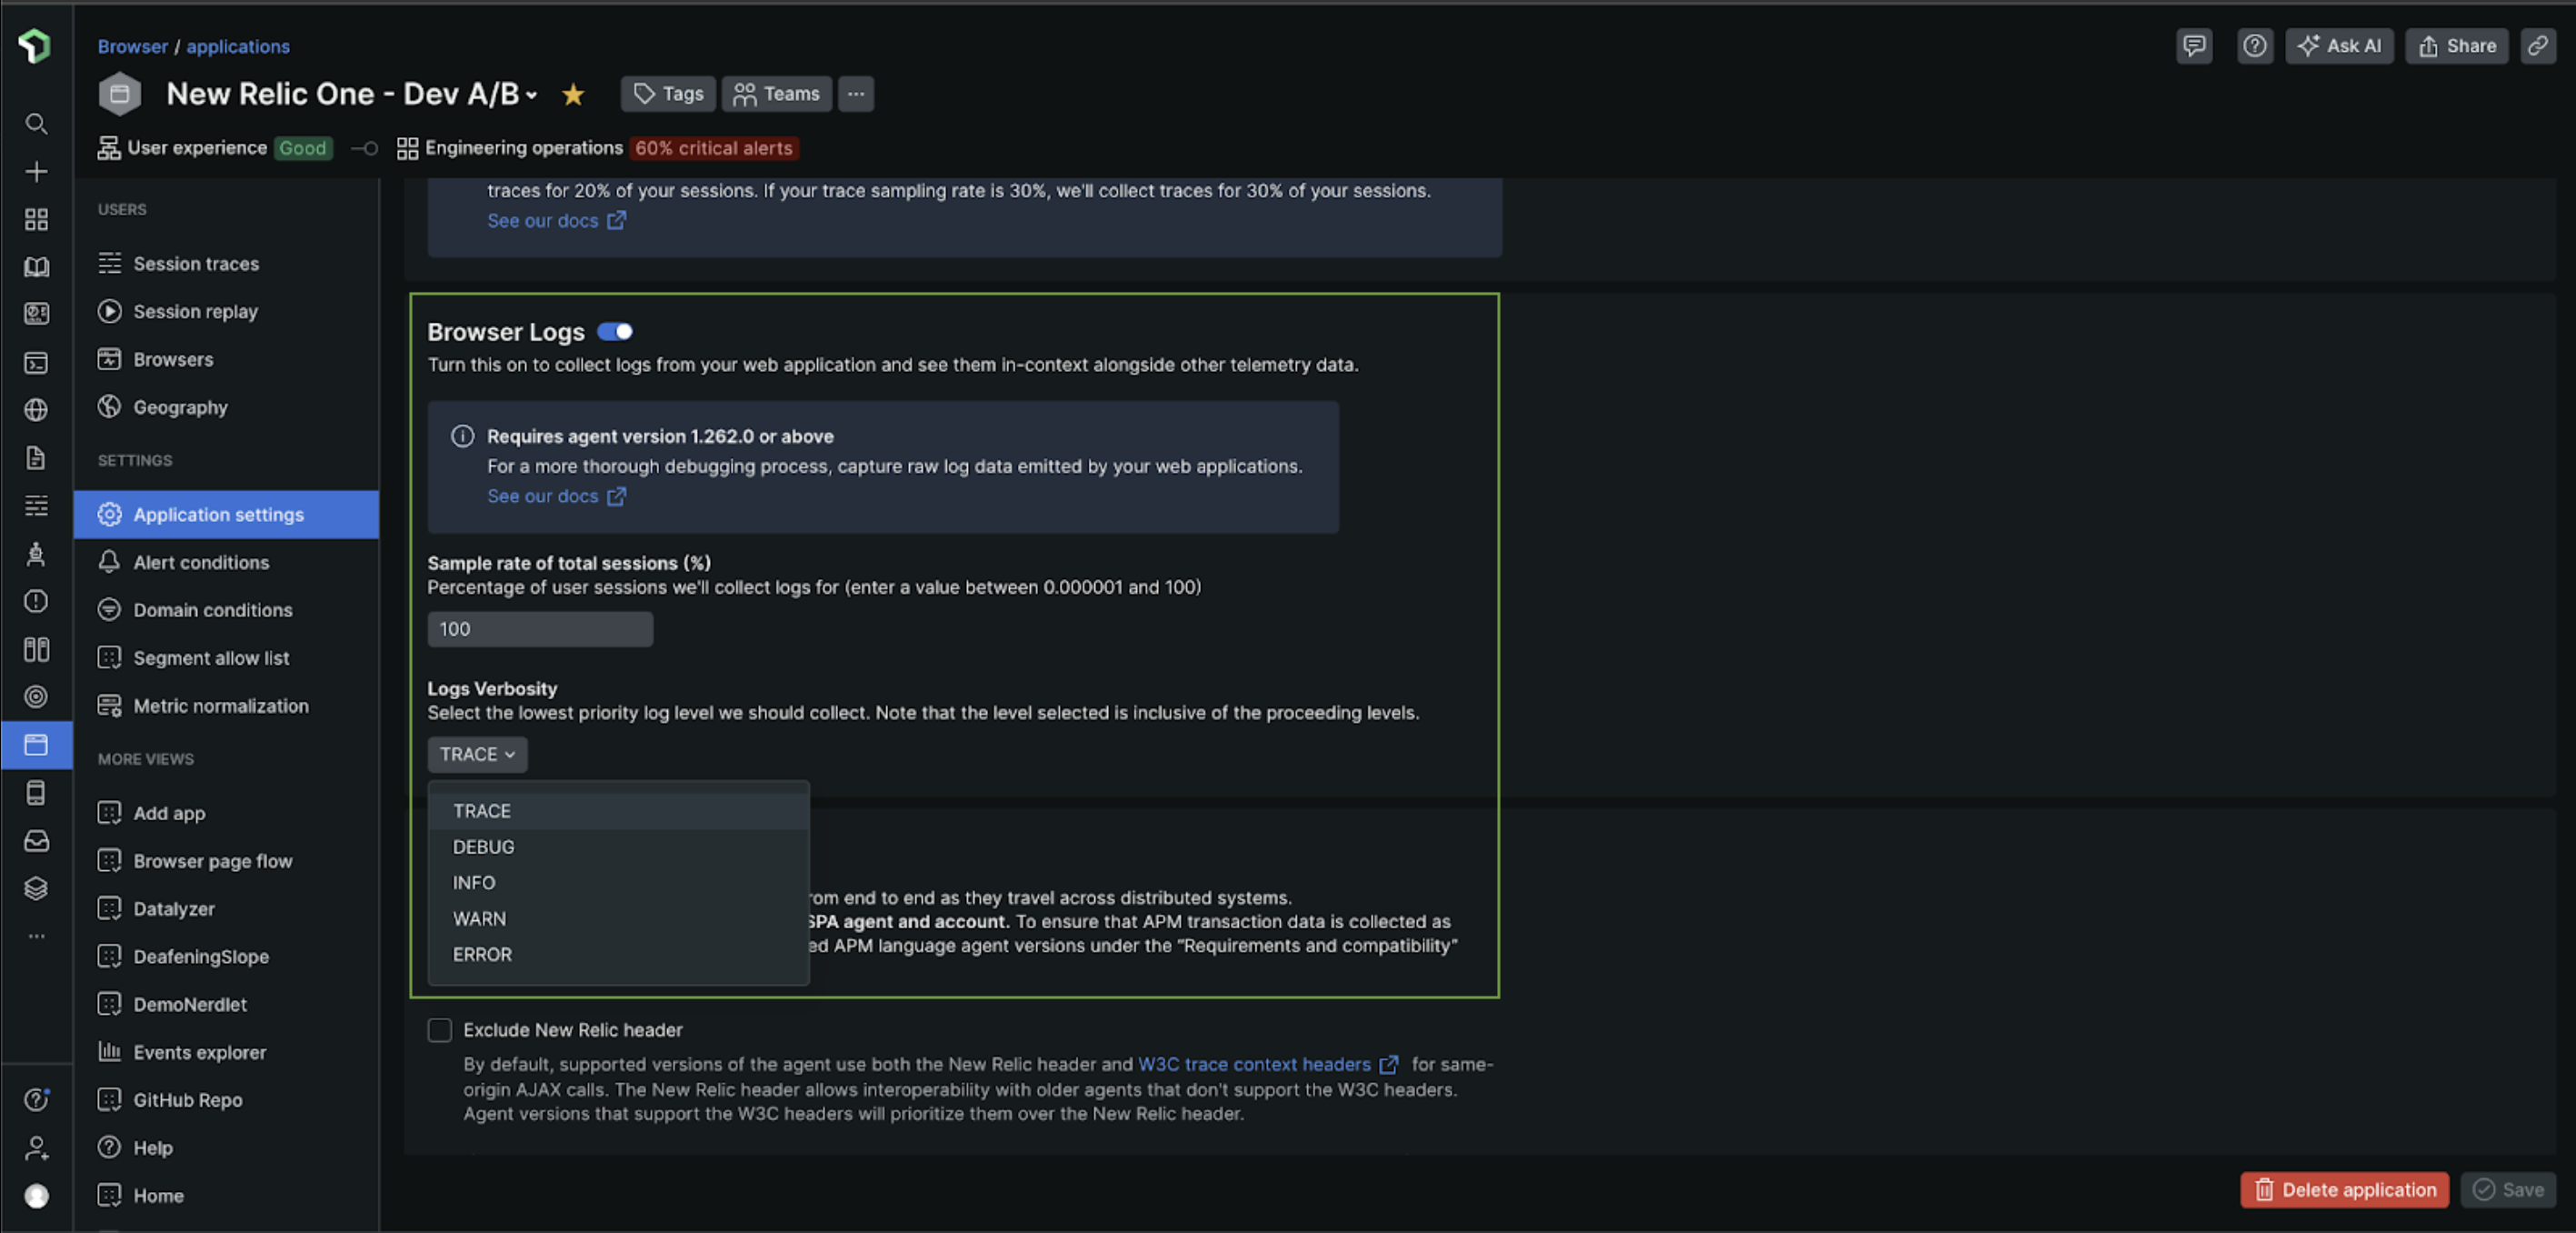
Toggle Automatically collect console logs to ON to collect messages sent to the browser's console.
Toggle Collect logs manually to ON to collect logs sent programatically via newrelic.log() or newrelic.wrapLogger().
Edit the sampling rate to specify the percentage of user sessions to collect logs. You can enter a value between 0 and 100.
Important
The default sampling rate for browser logging is set to 100% of user sessions. You can set this session sampling rate anywhere between 0% to 100%. For example, setting the session sampling rate to 50% will result in log event collection from approximately half of randomly selected user sessions.
Select the desired browser log verbosity level. The default verbosity level is set to WARN. The levels you can choose from:
ERROR- collect logs withERRORlevelWARN- collect logs withWARNorERRORlevelINFO- collect logs withINFO,WARN, orERRORlevelDEBUG- collect logs withDEBUG,INFO,WARN, orERRORlevelTRACE- collect logs withTRACE,DEBUG,INFO,WARN, orERRORlevelImportant
Data passed through the console methods may go through serialization and obfuscation. Depending on the size and frequency, this may negatively impact application performance as well as data costs. In general, it is NOT recommended to pass in large objects or large amounts of data into console methods.

Disable browser logs
To disable browser logs for an existing browser app:
Go to one.newrelic.com > All Capabilities > Browser.
Select your browser app.
In the left-hand menu, click Application settings.
Toggle Automatically collect console logs and Collect logs manually to OFF.
Data consumption
Logs follow the same consumption pricing as your other browser bytes. The amount of bytes produced depends on the count and length of messages.
The auto logging feature eliminates the need to call the newrelic.log or newrelic.wrapLogger browser APIs, except when adding custom attributes to logging events.