Snowflake monitoring integration
Our Snowflake integration lets you collect query performance data. You can also collect data on the health of your storage systems and warehouses. The integration then presents this data in a set of pre-built so you can view your most important query data in one place.
ヒント
This integration falls under the Community project designation in our Open Source categories. The community provides input through issues and PRs to develop this code openly. There is an active maintainer team within New Relic, as well as troubleshooting support in the New Relic Explorers Hub and documentation available in the project repository.

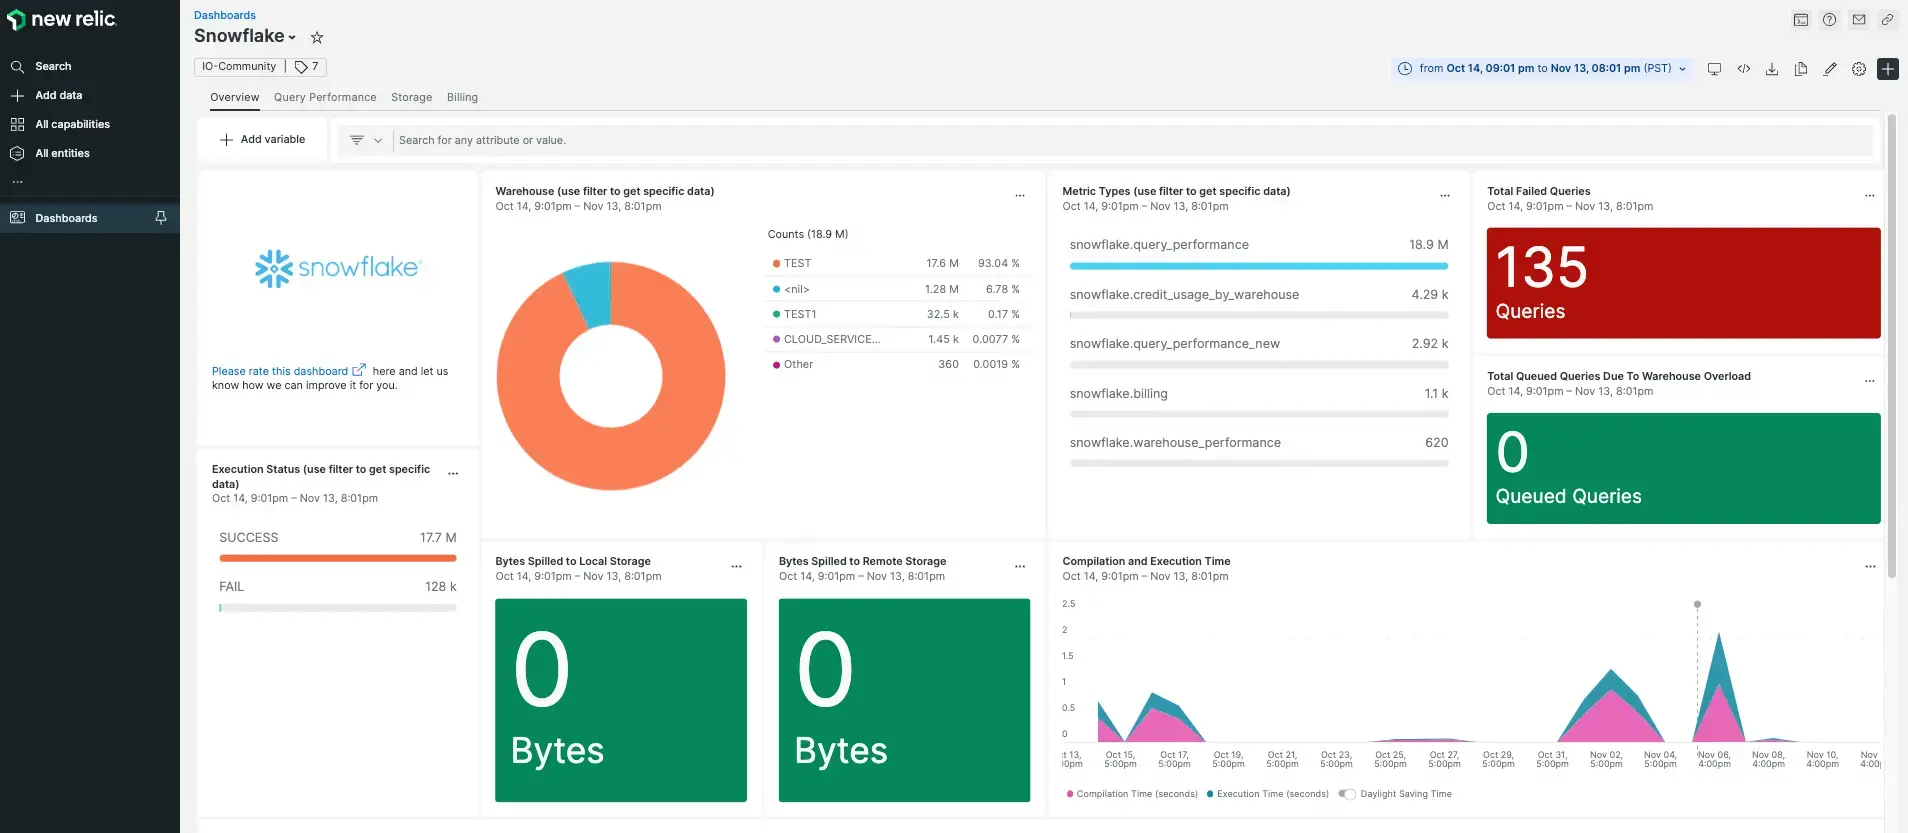
After setting up the Snowflake integration with New Relic, see your data in dashboards like these, right out of the box.
Configuration options
You can send your own custom metrics to New Relic and view that data in a dashboard. Check out these two examples of custom queries.
What's next?
To learn more about building NRQL queries and generating dashboards, check out these docs:
- Introduction to the query builder to create basic and advanced queries.
- Introduction to dashboards to customize your dashboard and carry out different actions.
- Manage your dashboard to adjust your dashboard display mode, or to add more content to your dashboard.