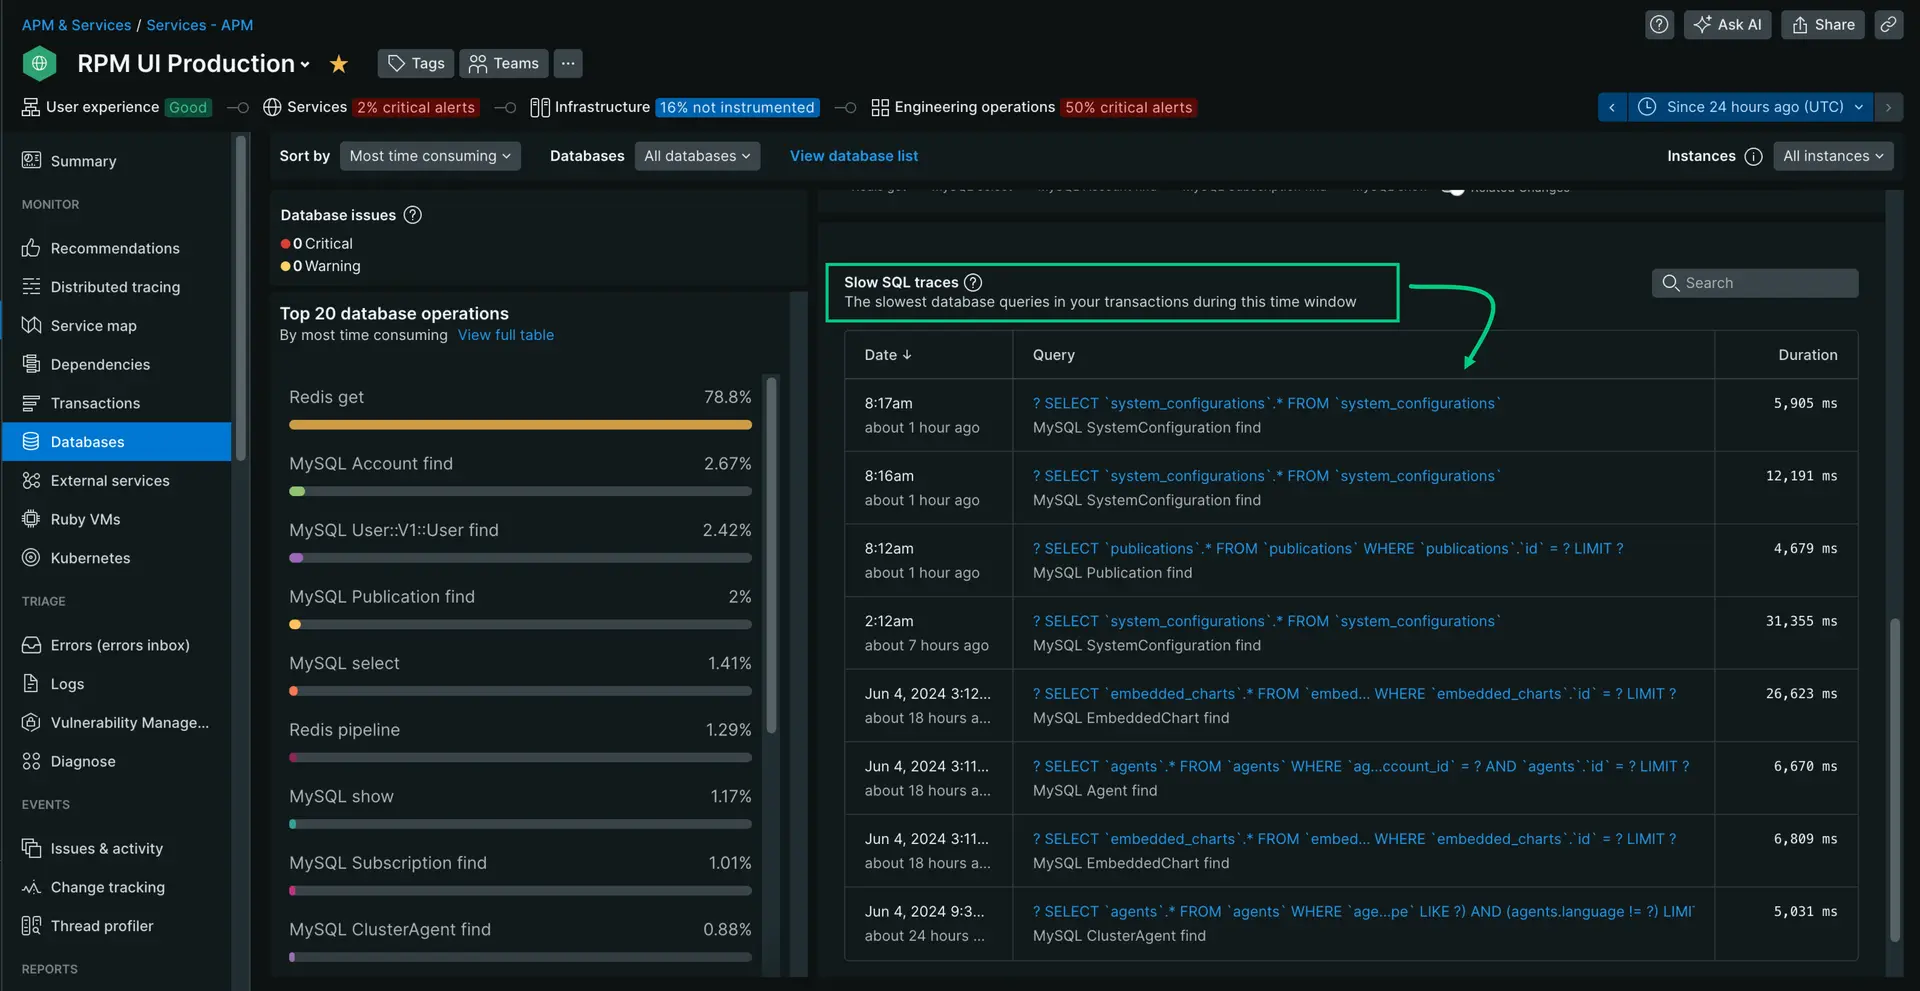
In APM, when we collect transaction traces, we might also find some additional Slow query data and display it on the Databases page. Let's look at what slow query data is, where to find it, and how to configure it.
Sampling of slow query data
When transaction traces are reported, the slow queries feature samples the slowest database queries in those traces and reports data about them on the Databases page. Slow query data can include:
- Duration of query segments
- Query/explain plans (if recognized)
- Host and instance level details (if supported by agent)
View slow query data
You can view data about slow SQL queries in our APM UI:
- Go to one.newrelic.com > All capabilities > APM & Services.
- Select an app.
- Under the Monitor section, click Databases.
- Select a database transaction.
- Click on any slow queries to get details.

If you do not see expected slow query data, follow the troubleshooting tips.
Configuration
In general, you can configure your slow query settings either of these ways:
- Agent configuration (see below)
- Server-side configuration (if available for your agent)
Agent configuration gives you more options than server-side configuration does. How you choose to configure slow queries will depend on your own setup and preferences. For more information, see the documentation for the specific agent:
Slow queries metrics
The slow queries list contains the following metrics:
Metric | Description |
|---|---|
| The average response time (in milliseconds) for the statements sampled. |
| The number of slow queries identified in the sample. |
To view additional details, select an individual slow query:
Metric | Description |
|---|---|
| When the stack trace began collecting the data shown. |
| The maximum time for all similar query statements in the sample. |
| The action or process invoking the query. |
| The query that is being reported as slow. Depending on your configuration, some parts of the query may be obfuscated. |
| Where in the code the statement was called. |
For MySQL, we provide a query analysis, which explains what happened in your query and what you might do to speed it up. Other databases display an explain plan whenever possible.
Troubleshooting: No slow query data
If you don't see slow query data, it's possible that we don't instrument your particular database for slow SQL.
It's also possible you have configuration issues:
- The slow query feature has been disabled.
- The duration of the threshold is set too high and no slow queries are being reported.
- The query obfuscation setting (usually
record_sqlor similar) may be set toOff.
See configuration options for more information.