In New Relic , the Browsers UI provides information about your end users' experience with your app based on which browser they use, such as Google Chrome, Mozilla Firefox, Microsoft Internet Explorer, Apple Safari, and Microsoft Edge.

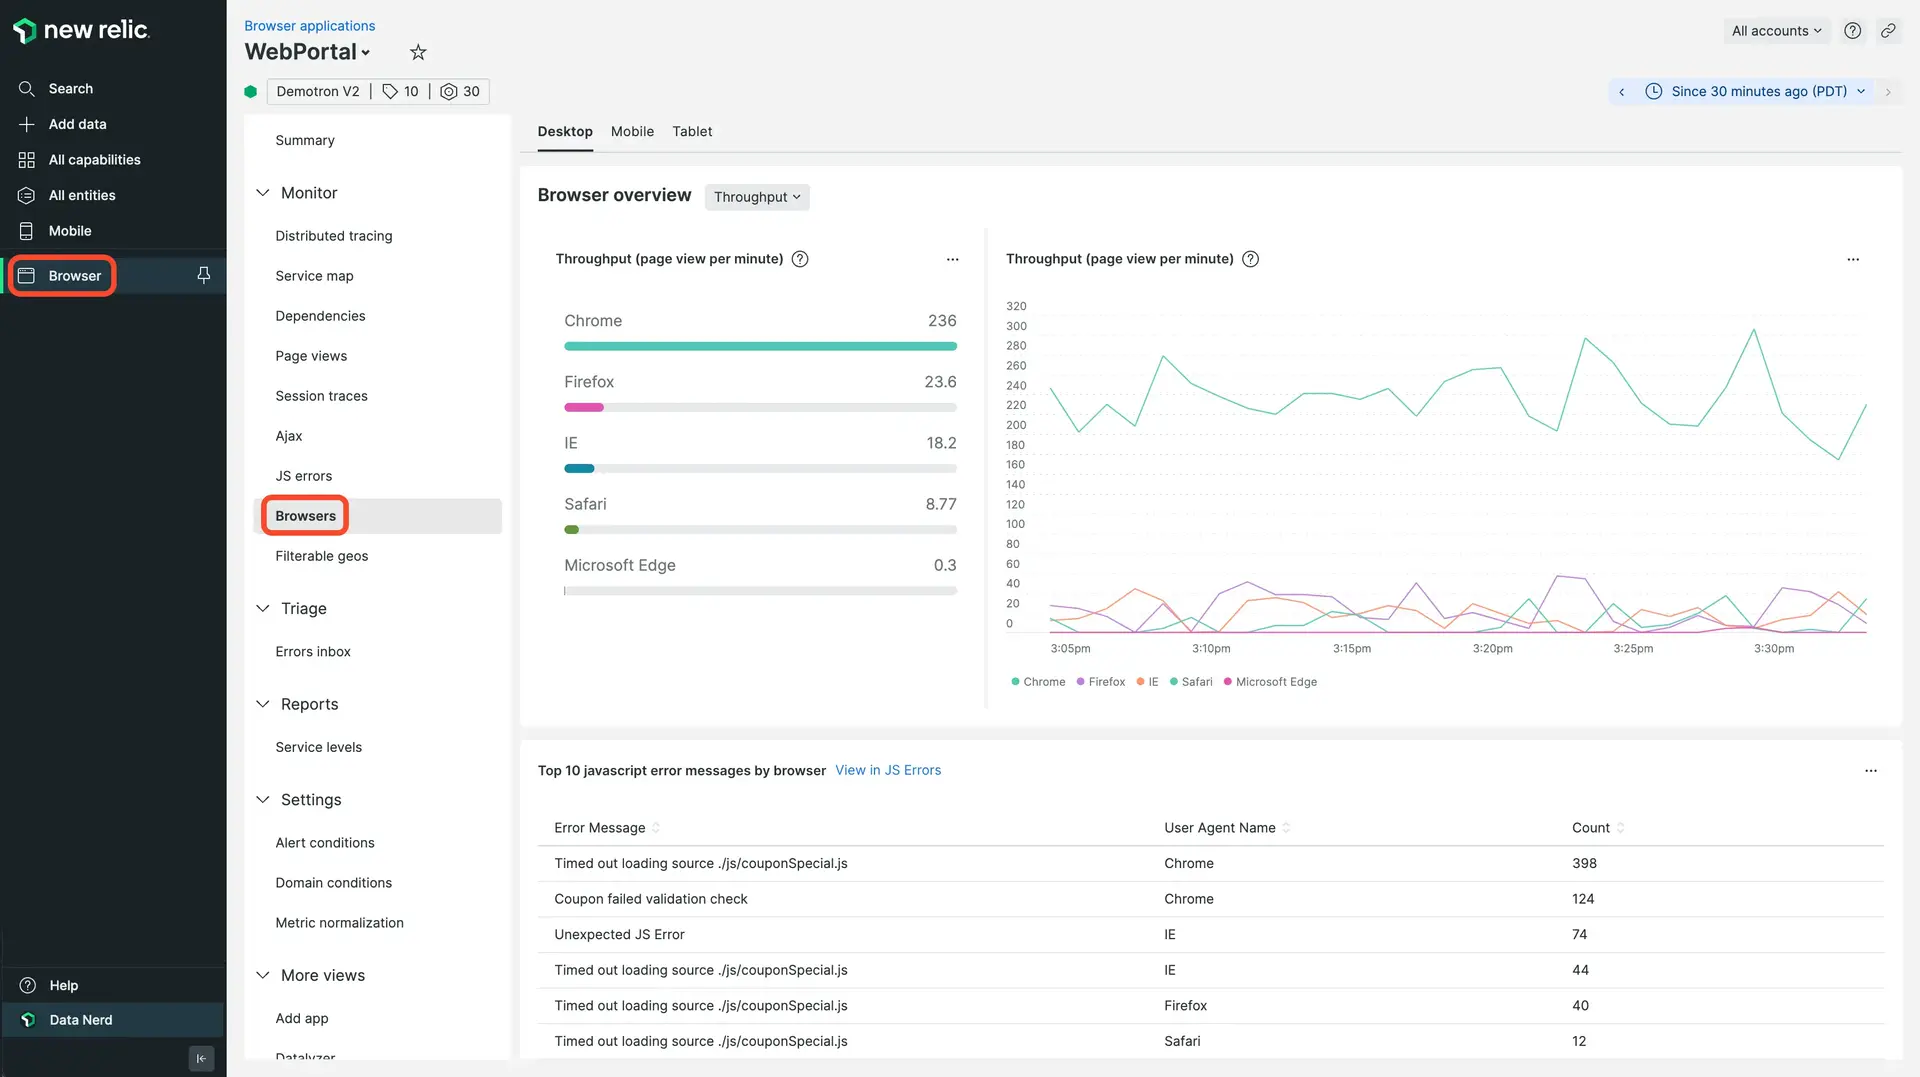
one.newrelic.com > Browser > (select an app) > Browsers: Get detailed information about your end users' experience by browser type and version, device, JS errors, page load timing details, throughput, and related Core Web Vitals data.
This page includes:
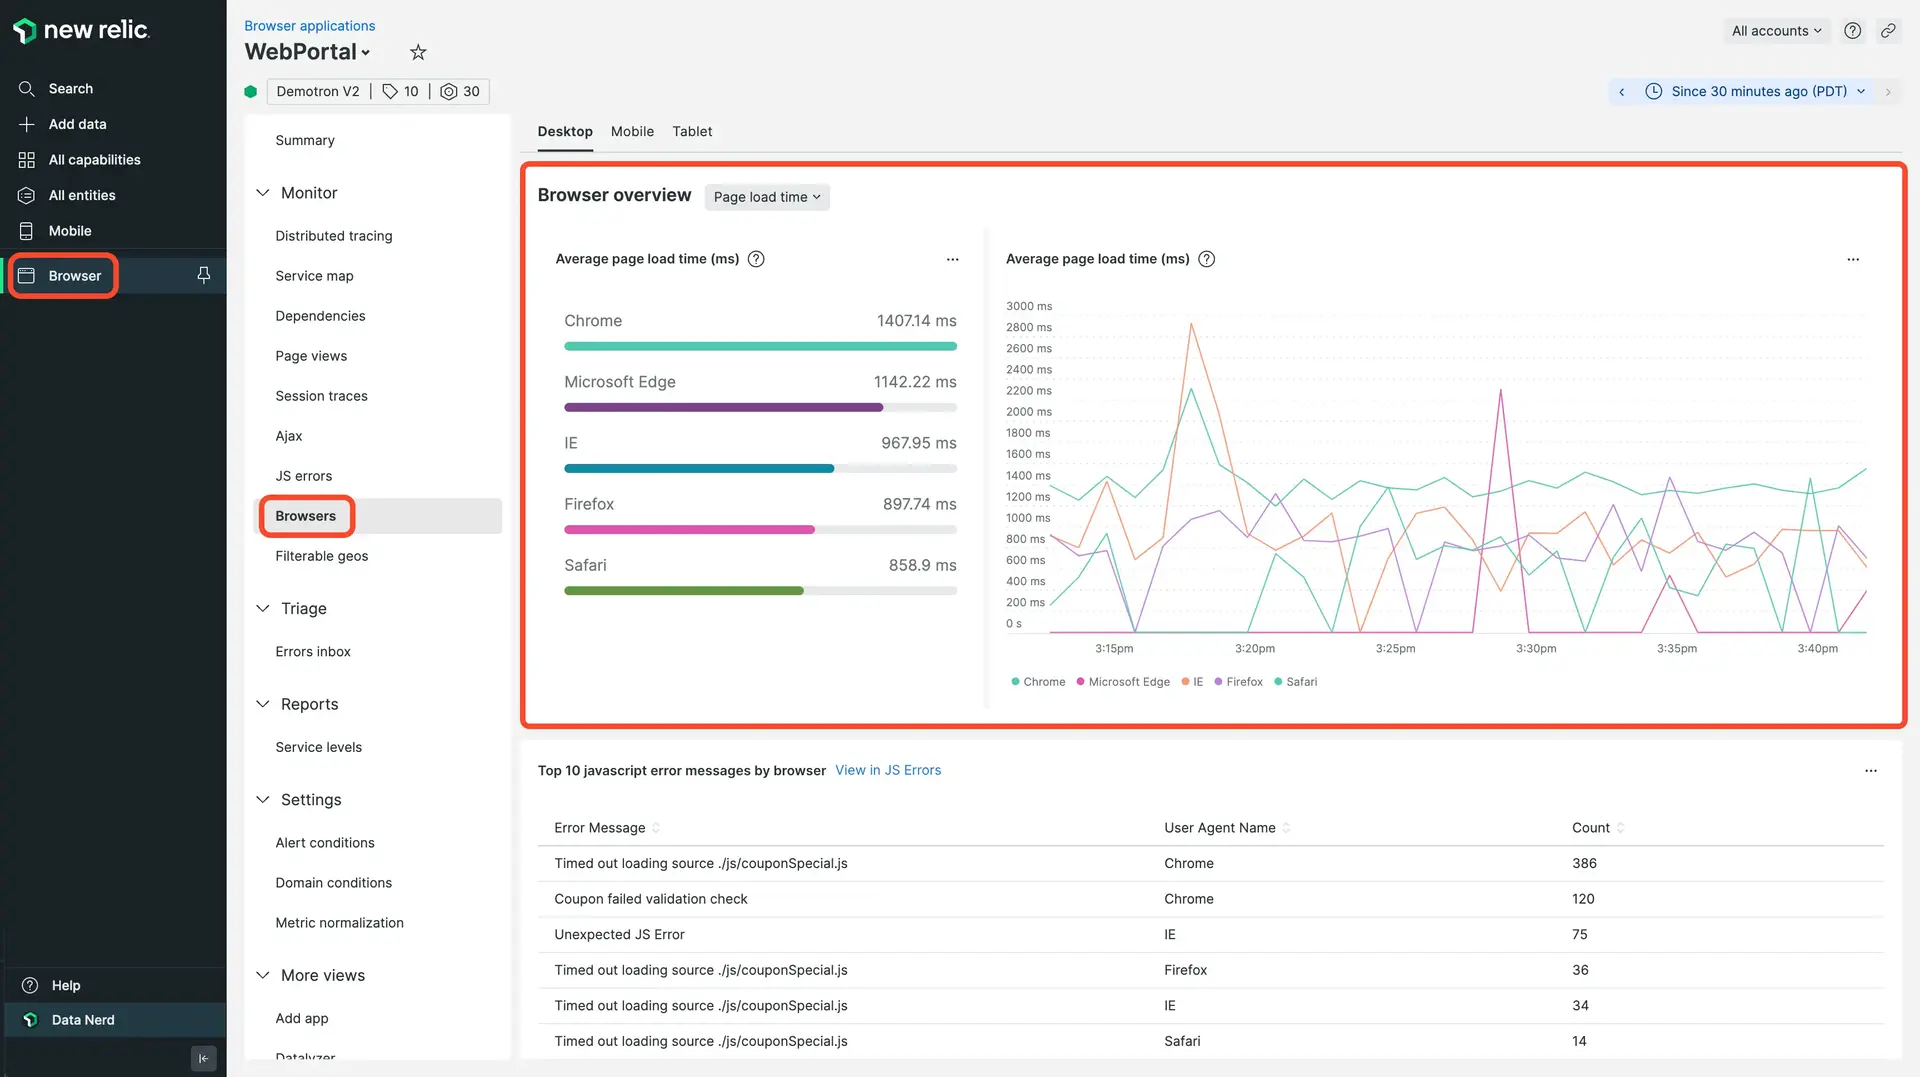
- Top browsers by throughput (page views per minute or
ppm) and page load time - Core web vitals data, including largest contentful paint (LCP), interaction to next paint (INP), cumulative layout shift score (CSL), and more
- Top JavaScript errors by error, with a link to more details in the JS errors UI
- Filterable data by device type (mobile, tablet, desktop)
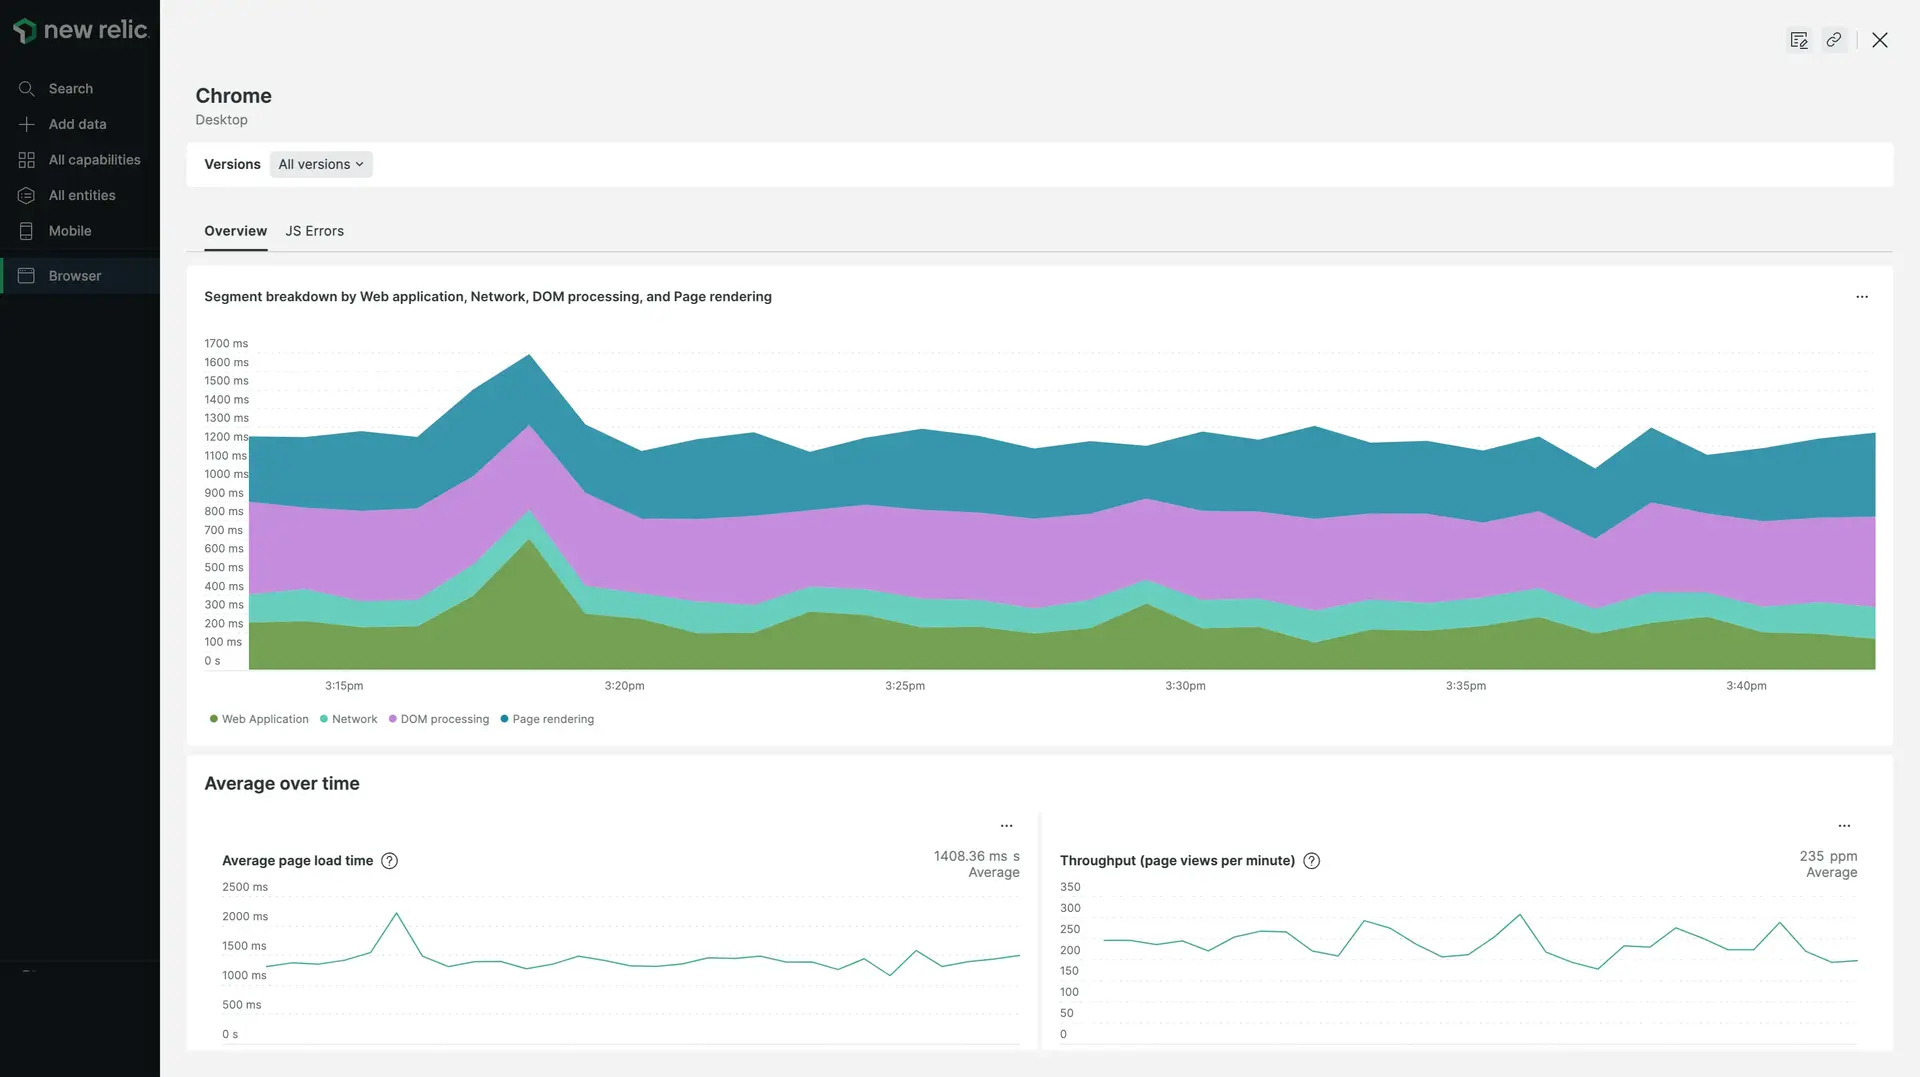
Drilldown charts also segment the selected browser type by version; for example, Chrome 14, 47, 72, etc. This helps you quickly determine whether problems with page load timing may be related to a specific browser type or device, or whether the problem is more widespread.
Use the Browsers UI
For example, if you want to investigate a slow page rendering issue, you can discover which users are impacted based on their browser type.
First, go to the Browsers page:
- Go to one.newrelic.com.
- Click Browsers and select an app.
- Under Monitor, click Browsers.
You notice that page load time is significantly longer for Safari browsers.

To investigate what's happening with Firefox browser, click Firefox from the browser type browser list and drill-down into browser-specific data.

Consider these questions when looking at the data:
- Where are spikes in the page load timing process?
- Are there recurring patterns over time?
- Are the average page load times and throughput within acceptable ranges?
- Are problems related to a specific browser version?
- Do the top JavaScript errors indicate a problem with the code, a potential security vulnerability, or something else?
- For this browser type, how are these performance problems affecting Core Web Vitals scores for first paint, first contentful paint, largest contentful paint, window load, and first interaction?
- How do these problems compare to other device types (desktop, mobile, tablet) or to other browser types?