Infinite Tracing (formerly called "New Relic Edge") offers trace observer monitoring so you can get additional insights into the sampling behavior of the trace observer. This optional feature shows you the amount of traces seen and kept by the trace observer. The trace observer metrics are written to the account you choose and available to view in Infinite Tracing settings or in our query builder.
When you enable monitoring, the trace observer metrics can be written to any account in your New Relic account hierarchy. This allows you to control the visibility of the metrics. Before you turn it on, you need to decide which account should receive the trace observer metrics.
팁
If you enable this feature, you'll see a small additional monthly charge. To give you an idea of what charges you might incur, under the current pricing model, you could see an additional monthly charge of 1.6 cents based on the following:
- Number of metrics: 2
- Rate: Every 10 seconds
- Attribute count: 2-5
Enable trace observer monitoring
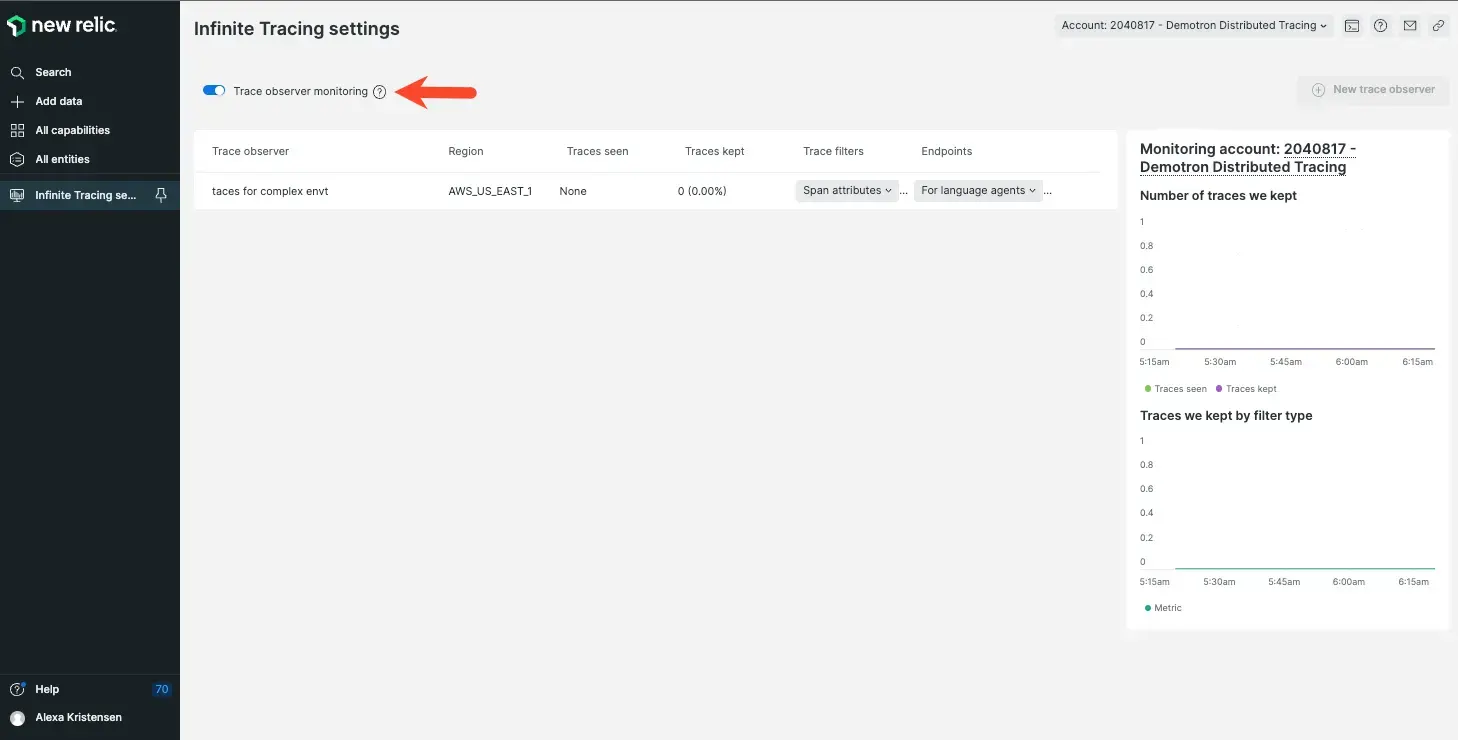
You can turn on trace observer monitoring by clicking a toggle in the New Relic UI. As soon as you enable trace observer monitoring, trace observer metrics are captured and displayed in the app or you can view them in query builder. Trace observer metrics are not retroactive and are only captured when trace observer monitoring is enabled.
To enable trace observer monitoring:
- Go to one.newrelic.com > All capabilities > Infinite Tracing settings.
- Confirm that you're in the the account where you want to record trace observer metrics.
- Click the Trace observer monitoring toggle.
Switch trace observer monitoring accounts
If you decide at some point that you want to change which account receives the trace observer metrics, you can do this in Infinite Tracing settings.
- Go to one.newrelic.com > All capabilities > Infinite Tracing settings.
- Use the account selector to switch to the account where you want trace observer metrics written.
- Click the toggle to disable trace observer monitoring.
- Click the toggle to re-enable trace observer monitoring in the current account.
팁
When trace observer monitoring is enabled or disabled an NrAuditEvent is written to the account where the change occurred. This event helps you keep track of any changes made to the trace observer.
View trace observer metrics
Anyone with access to the monitoring account can view the trace observer metrics in Infinite Tracing settings or in our query builder.
If you don't have access to the monitoring account, you can't see any trace observer metrics in Infinite Tracing settings or execute NRQL queries on these metrics. Here's what you see if you don't have access:

View metrics in Infinite Tracing settings
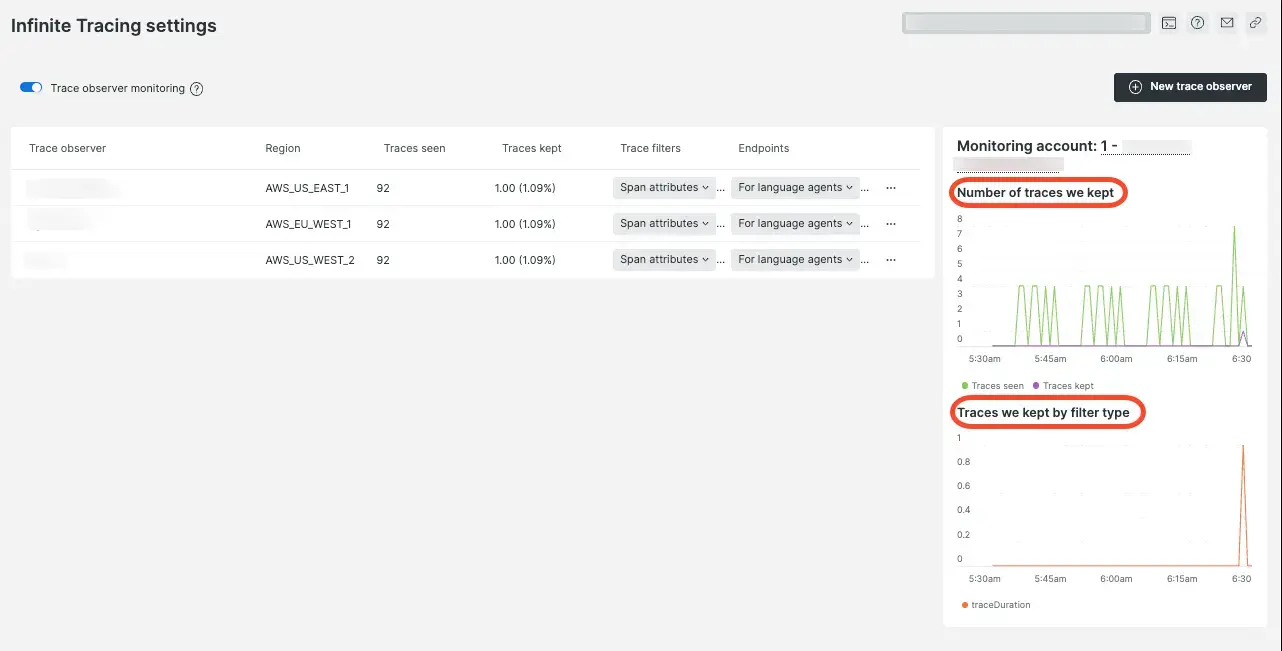
When you turn on trace observer monitoring, trace observer metrics are displayed in Infinite Tracing settings:
Two columns are added to the main trace observer listing:
- Traces Seen: How many traces were seen by the trace observer in the last 60 minutes.
- Traces Kept: The number and percentage of traces that were retained.
A new pane is added on the right side of the screen:
Monitoring account: At the top of the right pane, this is the account where the trace observer metrics are written.
How many traces were kept? (top chart): Shows the same information as Traces Kept, but it shows you what this looks like over time. You can see the magnitude of sampling and any trends.
Which traces were kept? (bottom chart): Shows which categories of traces were kept. The chart shows whether traces were captured by different types of Infinite Tracing filters:
- Duration (slow traces)
- Random
- Span attribute filters (traces with errors or other attributes you specify)

View in query builder
If you prefer a programmatic way to view the metrics, here are some examples of NRQL queries. These examples replicate the two charts from Infinite Tracing settings:
How many traces were kept? (top chart):
FROM Metric SELECT sum(monitoring.trace.opened.session.count) AS 'Traces seen', sum(monitoring.trace.sampled.count) AS 'Traces kept' WHERE account = INSERT_THE_MONITORING_ACCOUNT_ID TIMESERIESWhich traces were kept? (bottom chart):
FROM Metric SELECT sum(monitoring.trace.sampled.count) WHERE account = INSERT_THE_MONITORING_ACCOUNT_ID AND newRelic.traceFilter.type IS NOT NULL FACET newRelic.traceFilter.type LIMIT 3 TIMESERIES