New Relic has tools to help you monitor your software infrastructure so you can deliver reliable systems. Whether you work in the cloud, on dedicated hosts, or with containers running in orchestrated environments, you can use infrastructure monitoring to improve health and performance outcomes.

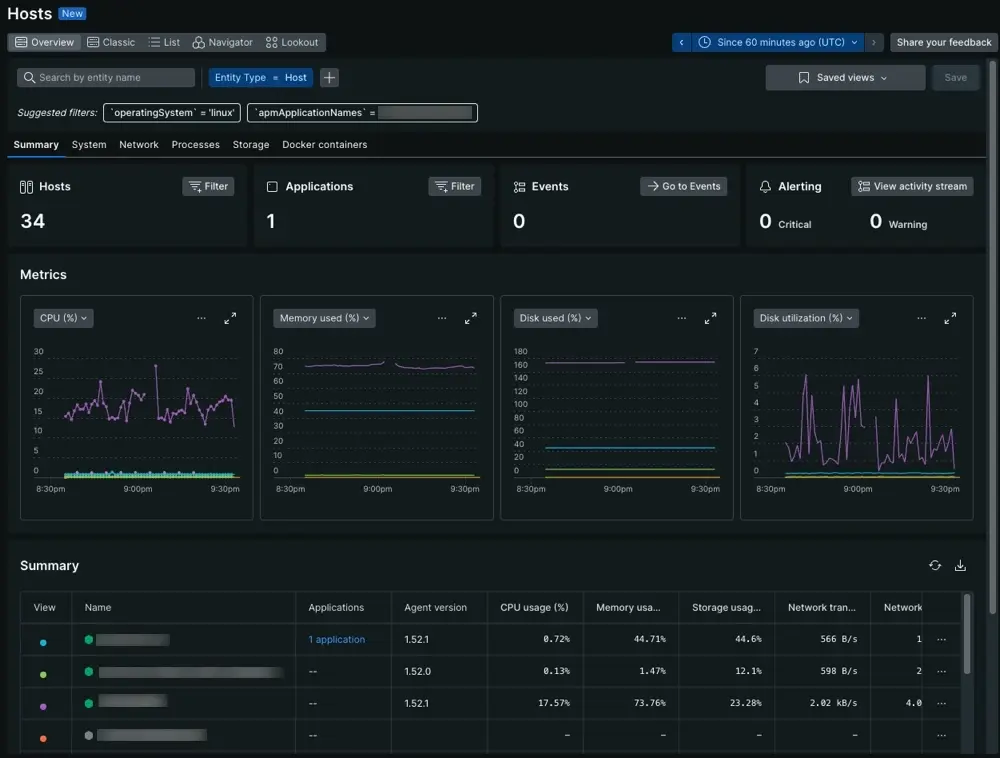
From one.newrelic.com > All Capabilities > Infrastructure:The Hosts page shows performance data about your systems, networks, processes, and storage.
On-premises and virtual host monitoring
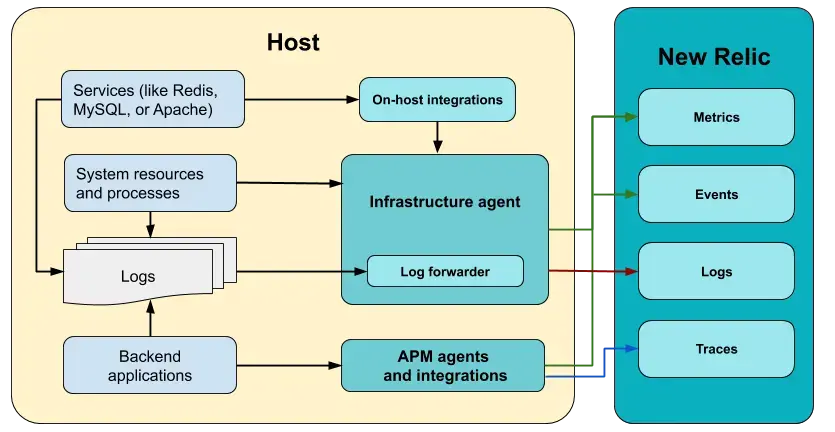
If you want to monitor on-premises or virtual hosts, you can install our infrastructure agent. It collects performance and health data about system resources and processes. From there, you can use the infrastructure agent in combination with a number of on-host integrations that extend monitoring to infrastructure tools such as databases, messaging services, and application servers. You can also use the infrastructure agent to forward logs.

You can install the infrastructure agent in Linux, macOS, and Windows systems. Depending on your observability needs, you have a few different options for deploying the agent in your system. We recommend reviewing our Choose your infrastructure agent install method to decide the option that fits your use case.
Cloud integrations
Our cloud integrations collect data from cloud platform services and accounts. There's no installation process for cloud integrations and they do not require the use of our infrastructure agent: you simply connect your New Relic account to your cloud provider account.
Integrations | Description |
|---|---|
Amazon Web Services (AWS) cloud integrations | Connect your Amazon Web Services (AWS) account to monitor and report data to New Relic. |
Microsoft Azure cloud integrations | Connect your Microsoft Azure account to monitor and report data to New Relic. |
Google Cloud Platform (GCP) cloud integrations | Connect your Google Cloud Platform (GCP) account to monitor and report data to New Relic. |
Infrastructure service integrations
Integrations | Description |
|---|---|
Connect your account to gain visibility of your Kubernetes environment, explore your clusters, and manage alerts. | |
Prometheus integrations | Monitor and report data from Prometheus with one of several options. |
Assorted on-host infrastructure integrations | Monitor and report data from many popular services, including NGINX, MySQL, Redis, Apache, RabbitMQ, and more. Start enabling them. |
Build your own | To create your own lightweight infrastructure integration, use our Flex integration. |
Reduce MTTR with actionable data
Real-time metrics and analytics reduce your mean-time-to-resolution (MTTR) by connecting changes in host performance to changes in your configuration. Here's an example of how infrastructure data can help you:
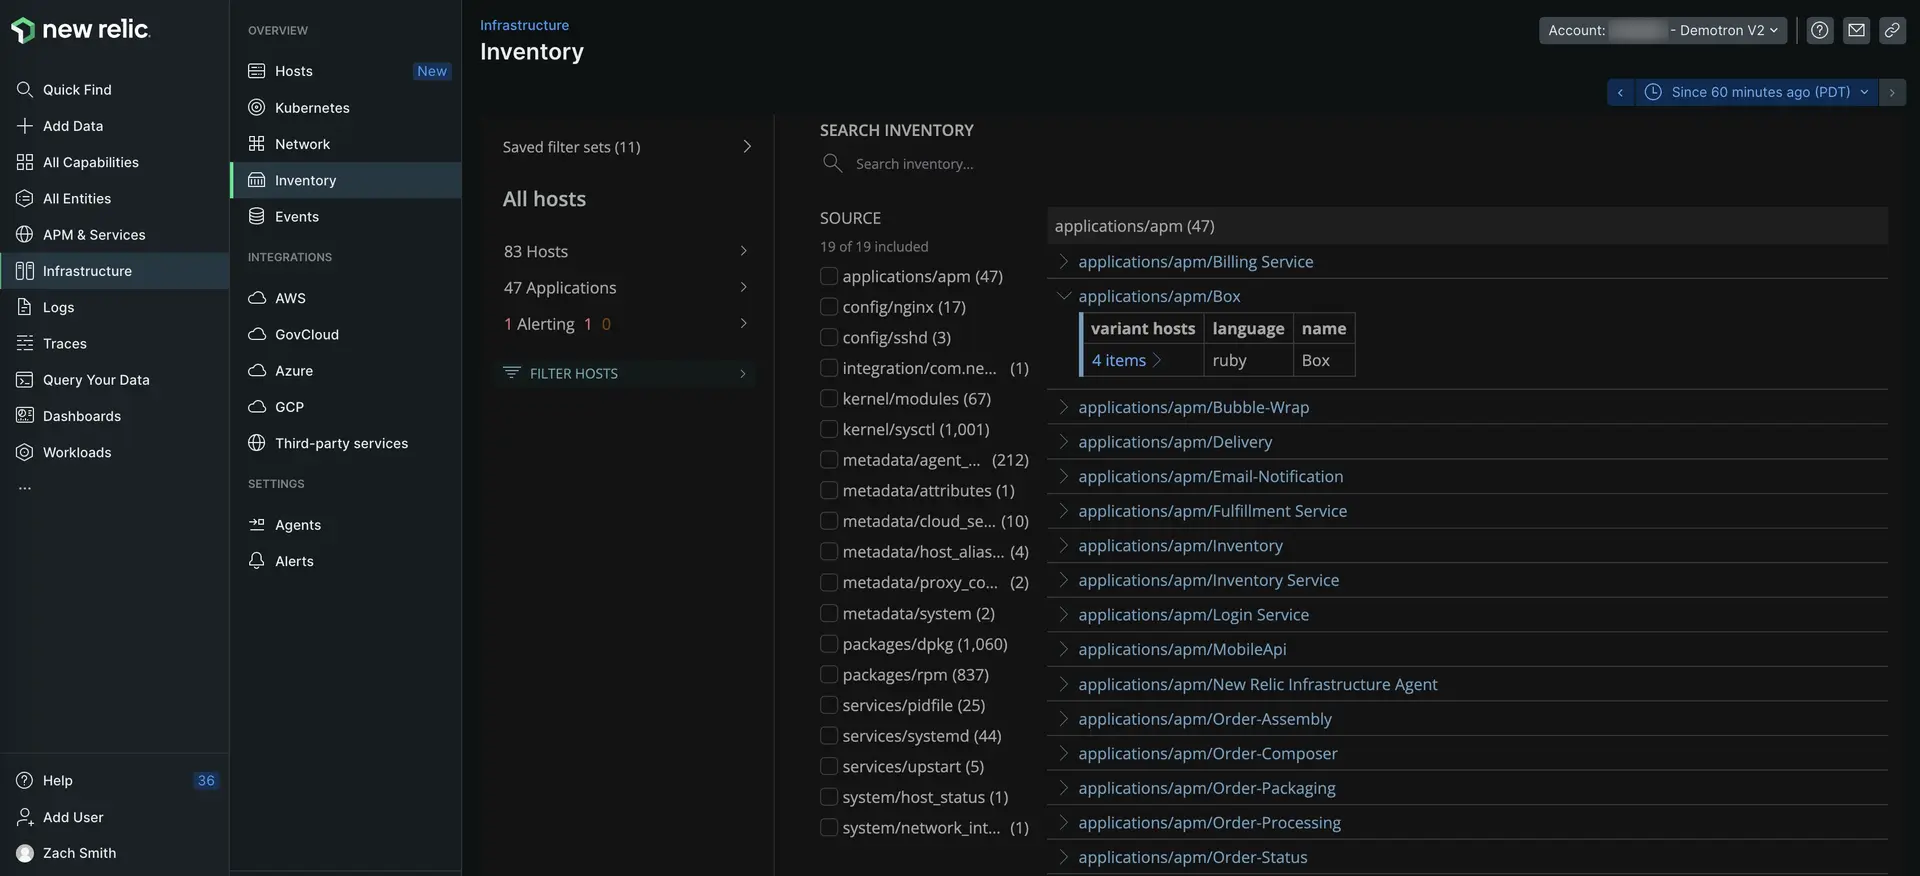
From the Inventory page, focus on all the infrastructure entities in your estate.

one.newrelic.com > All Capabilities > Infrastructure monitoring > Inventory: Search across your entire system to find exactly which of your hosts contain particular packages, configs, or startup scripts.
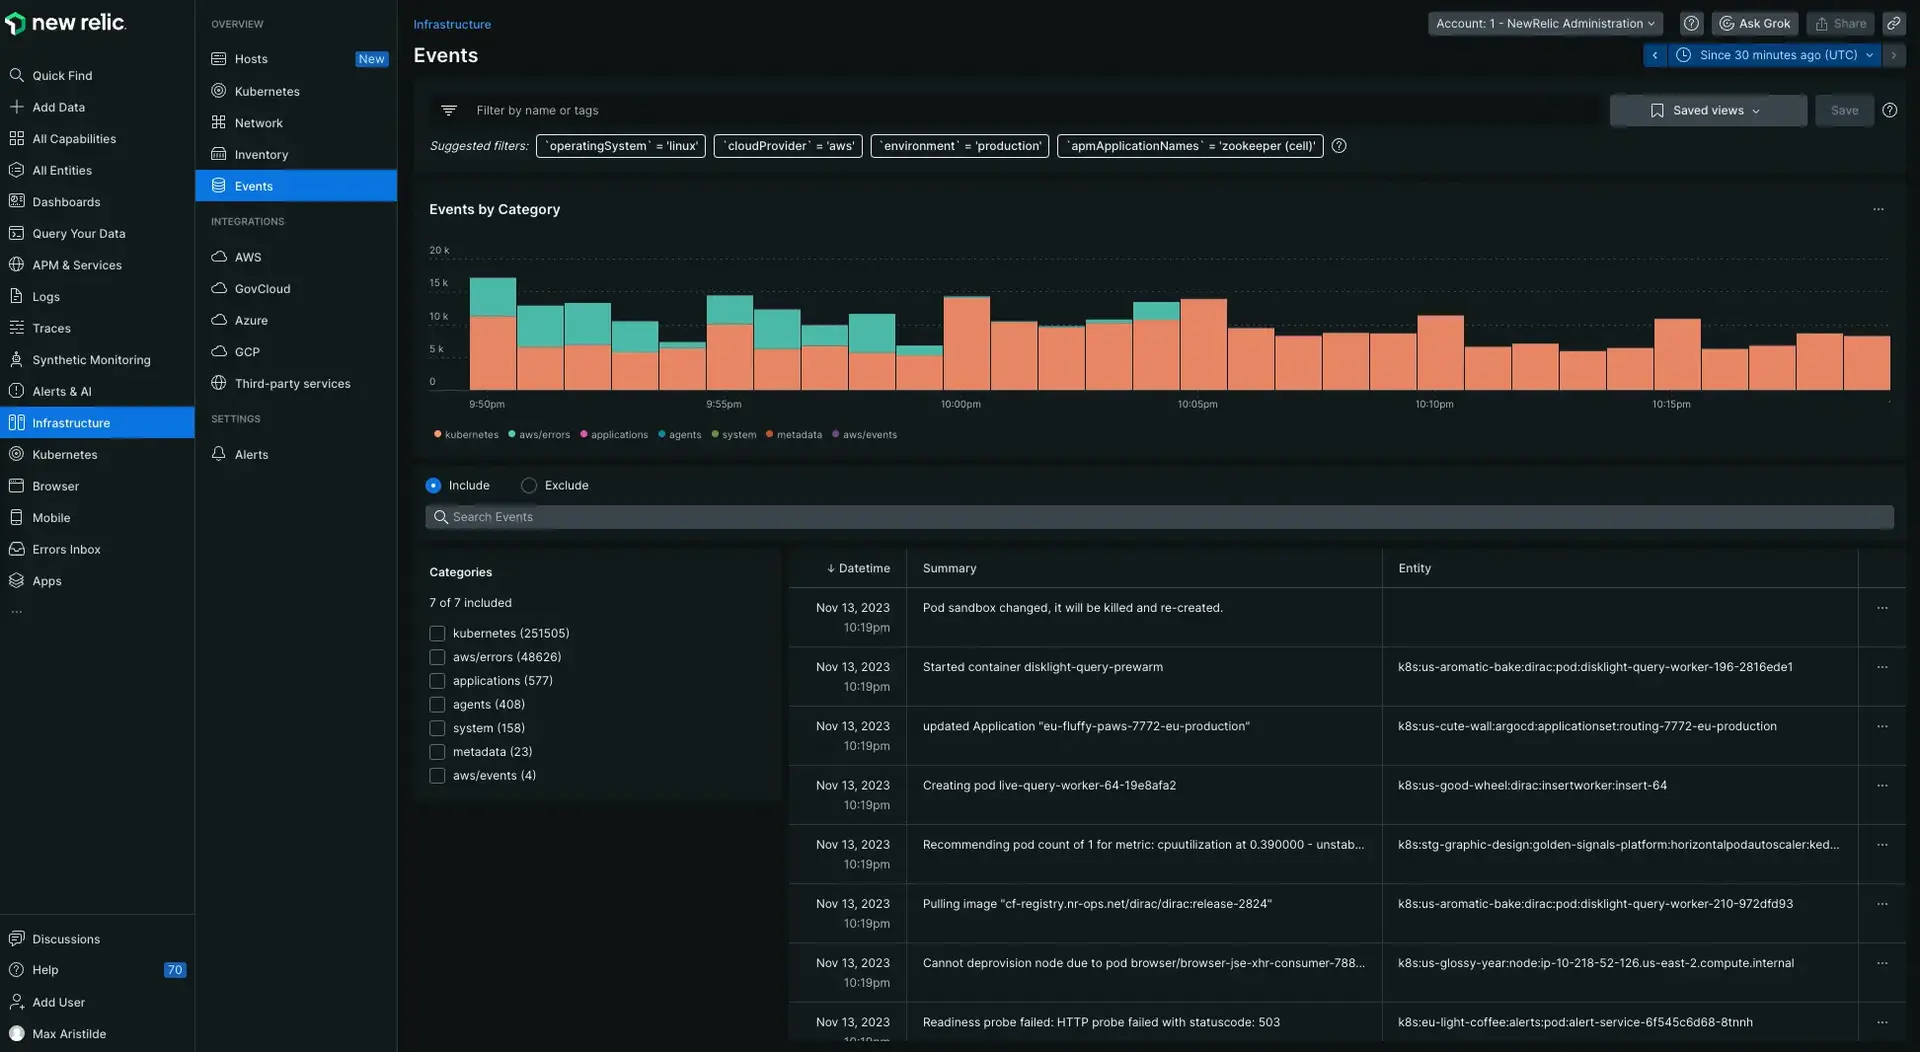
From the Events page you can track config changes, restarts, SSH sessions, and other key event changes. A real-time feed gives you a changelog for your entire infrastructure.

The Events page contains a real-time feed of all that is happening in your hosts.
However you use it, our solution securely collects and displays your data so your monitoring never lags behind reality.
View logs for your infrastructure and app data
Bring your logs and infrastructure data together to make troubleshooting easier and faster! With logs in context, you can see logs of your infrastructure data, such as Kubernetes clusters. You can add as many configuration files as you need. These files serve as the sources that push your log metadata to our platform.
You can also see log messages related to your errors and traces directly in your app's or host's UI. For more information, see our APM logs in context documentation.
If your agent doesn't support our automatic logs in context solution yet, you can continue to use our manual logs in context solutions, and forward your logs via our infrastructure agent or other supported third-party log forwarder.