The New Relic integration with Pixie gives you the best of both worlds: Pixie’s advanced, eBPF-based Kubernetes observability coupled with New Relic’s alert event correlation, intelligent alerting, and long-term retention.
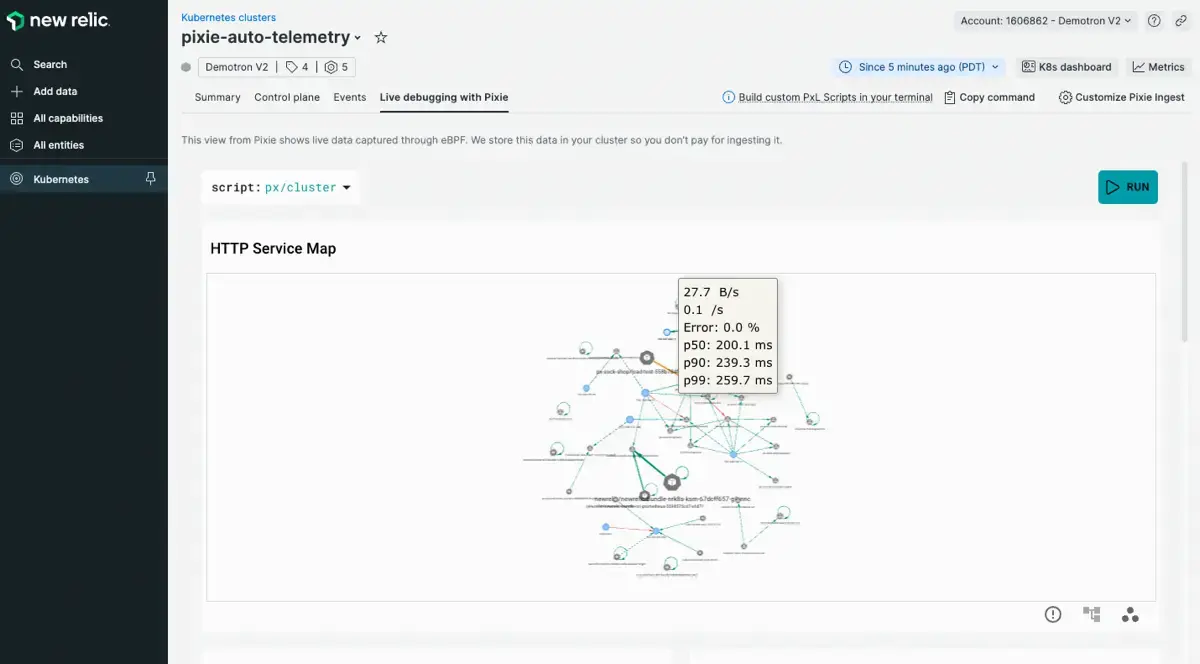
What is Pixie?
Pixie is an open source observability tool for Kubernetes applications that is designed to alleviate pain points developers face with traditional observability.
Pixie uses eBPF to automatically collect fine-grained telemetry data — service-level metrics, unsampled requests, and more. With one install command, you get deeper insight into your Kubernetes clusters and workloads. No language agents required!
Advantages of the New Relic Pixie integration
New Relic offers the best-in-class commercial integration of Pixie. With the New Relic integration, you get all of Pixie’s standard features plus:
- Long-term storage of Pixie telemetry data
- Alerting using Pixie telemetry data
- Ability to see Pixie telemetry data in context with logs and other data
- Commercial support
Ready to get started? You'll be able to configure Pixie to suit your environment after you create a New Relic account (it's free, forever!) and install our Pixie integration.
중요
Auto-telemetry with Pixie leverages Community Cloud with Pixie, a separate platform from New Relic. Use of Community Cloud with Pixie is subject to separate terms of service.
Quickly start observing and debugging Kubernetes clusters
Once you install the New Relic Pixie integration, Pixie will begin automatically collecting a variety of metrics and traces.
You’ll get visibility into HTTP services using golden signals, service maps, HTTP transactions, and database transactions. You can operate, debug, and scale your Kubernetes clusters based on the information you learn about how your clusters and services are running.
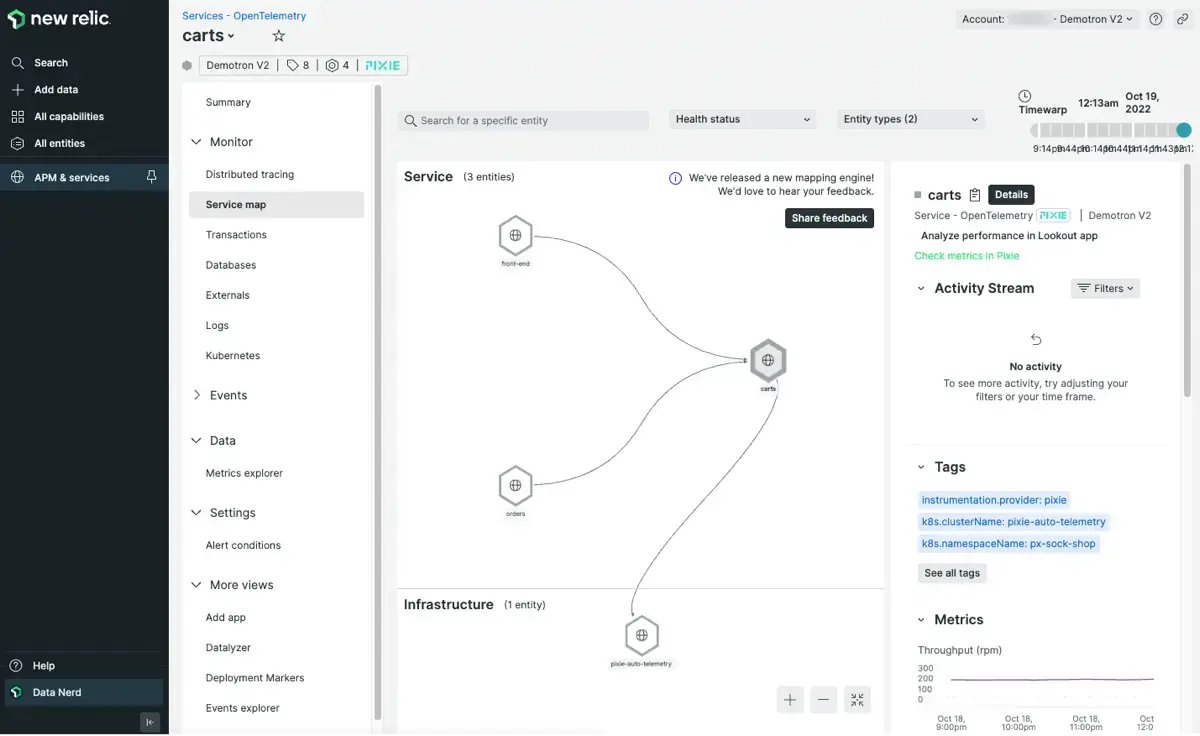
Visualize your application's dependencies using the Service map created from Pixie's HTTP traces.
Using the Kubernetes cluster explorer, you can see key metrics and events at every level, starting with the cluster, and diving down into namespaces, deployments, and pods. You can quickly spot anomalous behavior, and where it’s happening.
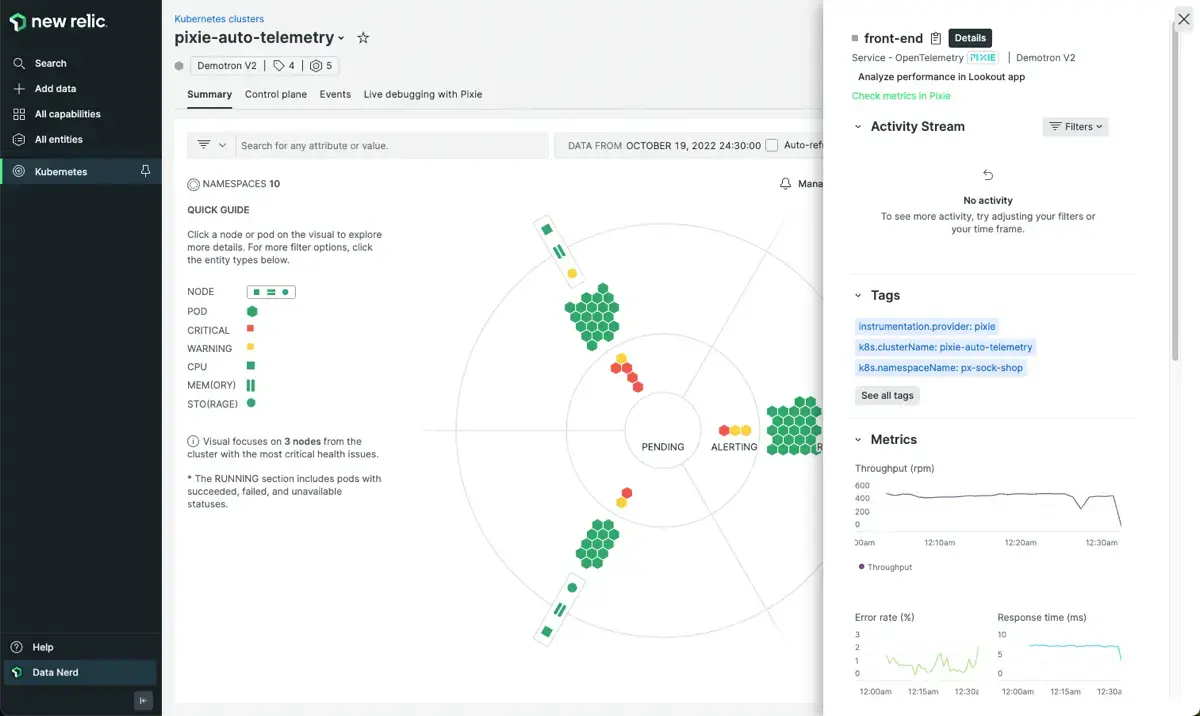
The pod details page in the Kubernetes cluster explorer shows application metrics collected by Pixie.
Inspect full-body requests and responses made by your applications. Available for select protocols including DNS, Cassandra, MySQL, PostgreSQL, Redis, Kafka and AMQP.
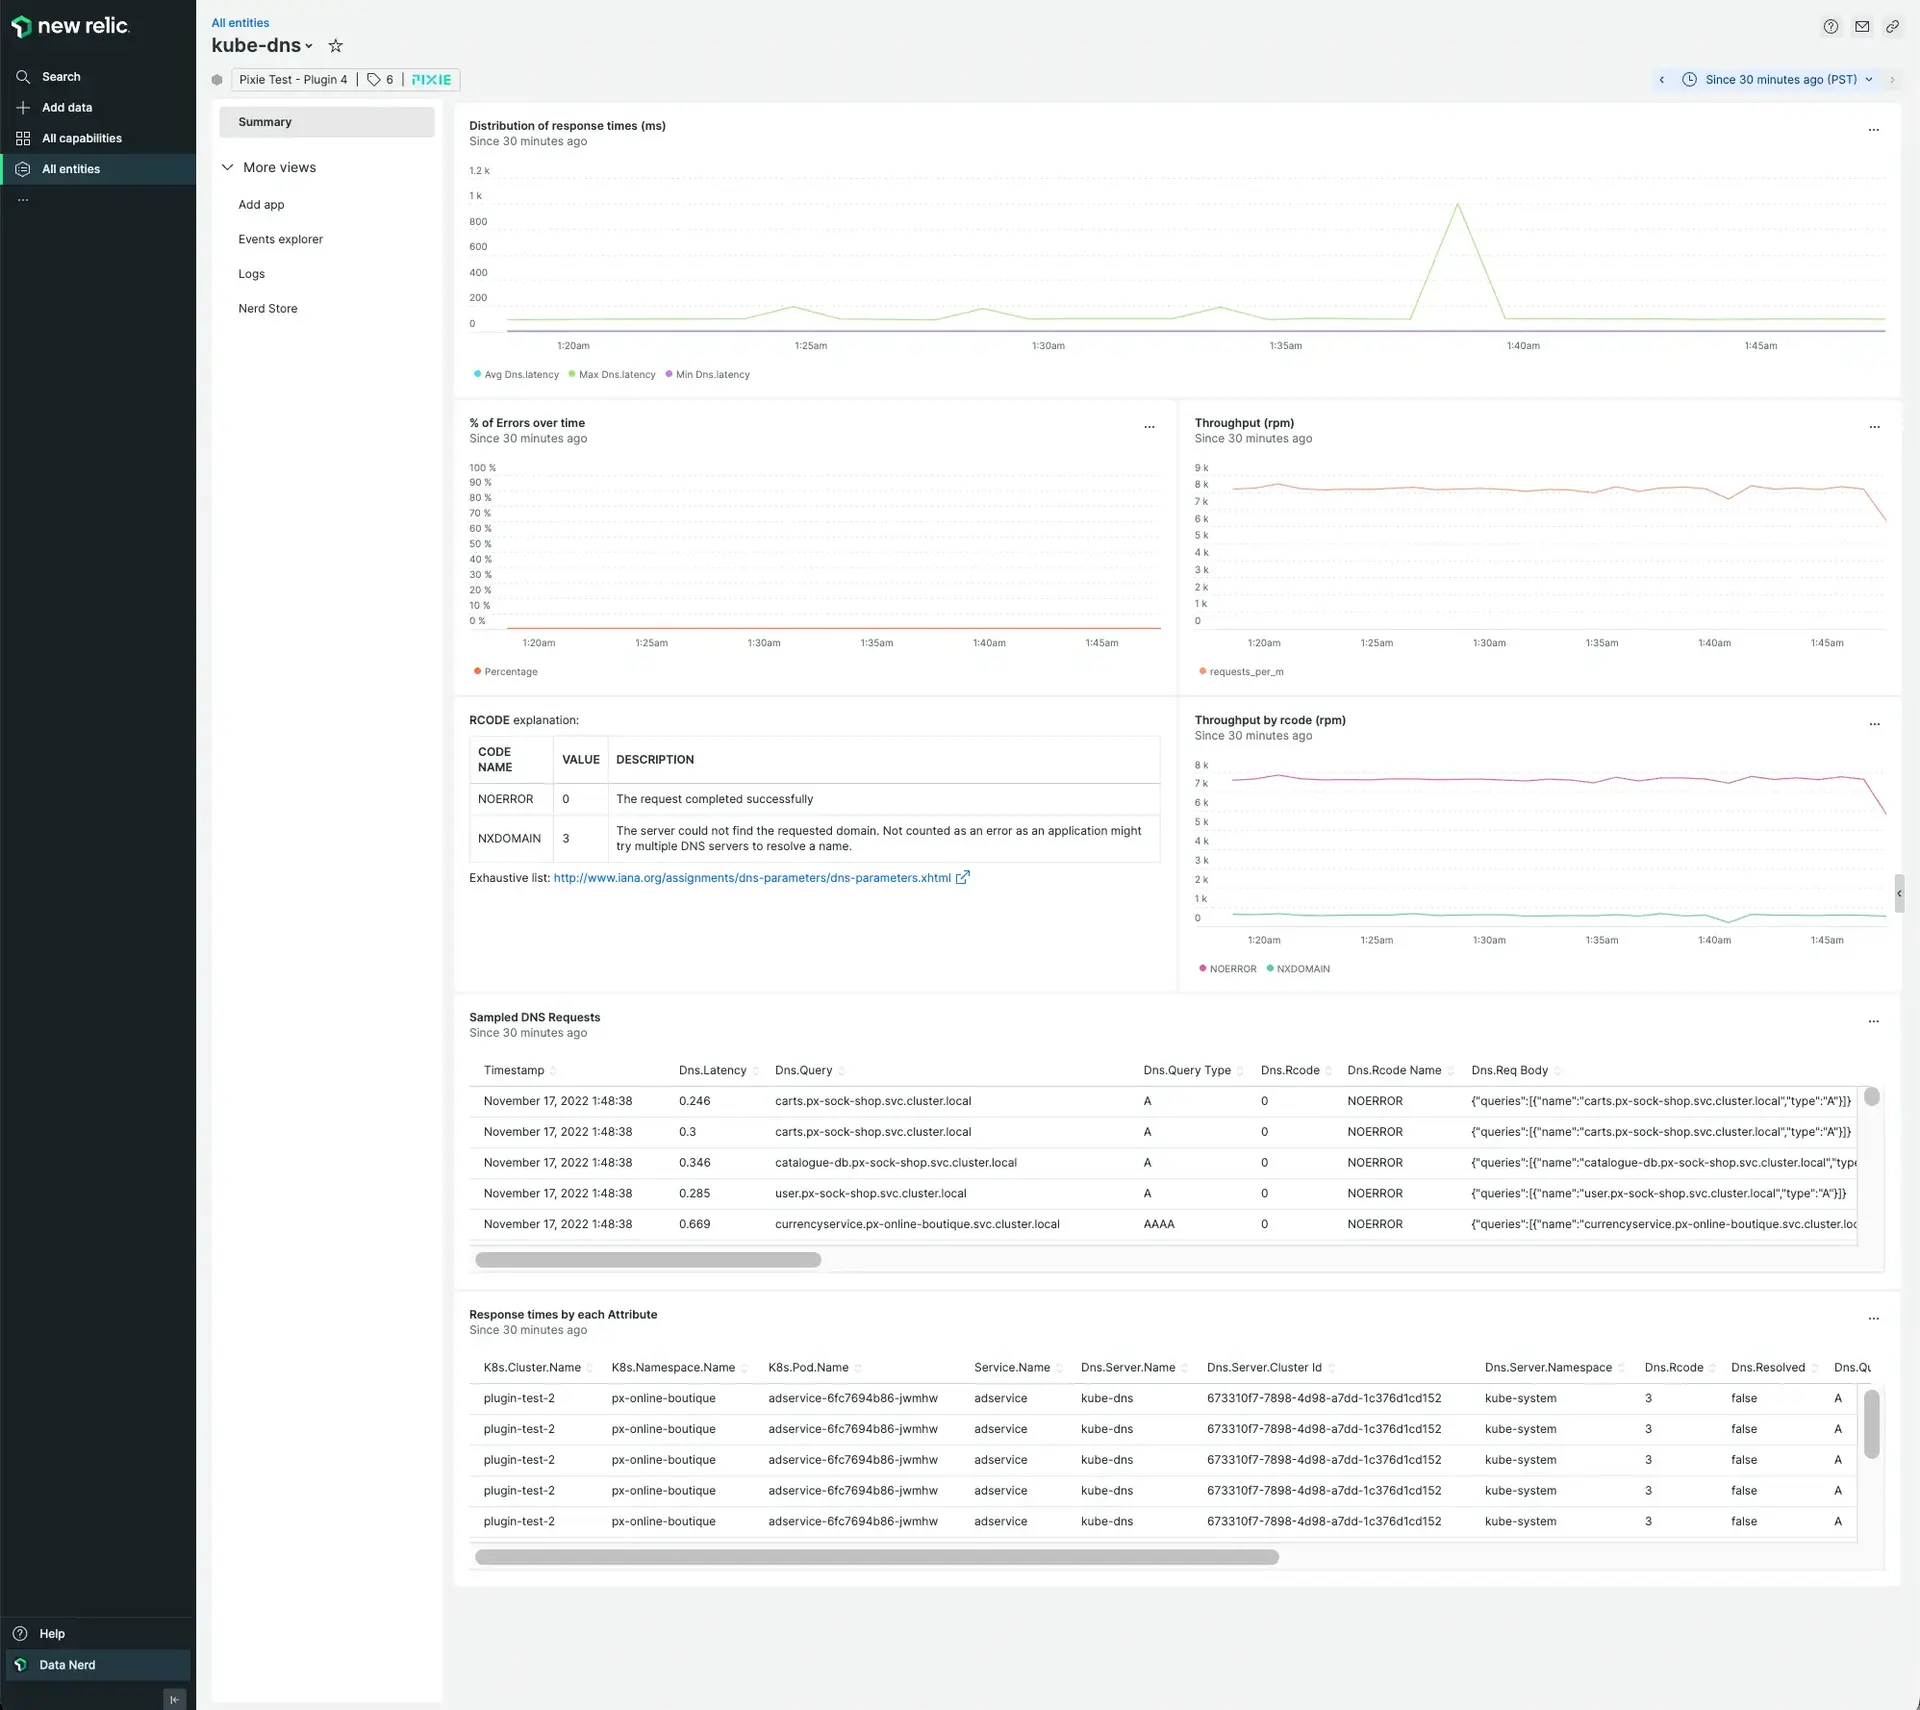
The Pixie DNS entity shows full body DNS request and response pairs traced by Pixie.
Quickly identify hot spots with application CPU flame graphs. Debugging is orders of magnitude easier when you can quickly see what your application is doing. The Pixie flame graph display requires no instrumentation, redeploying, or recompiling. It works for compiled languages like Go, C+, Rust, to name a few. And at a glance, the flame graph tells you what functions your application is spending time on and where you have hot spots.
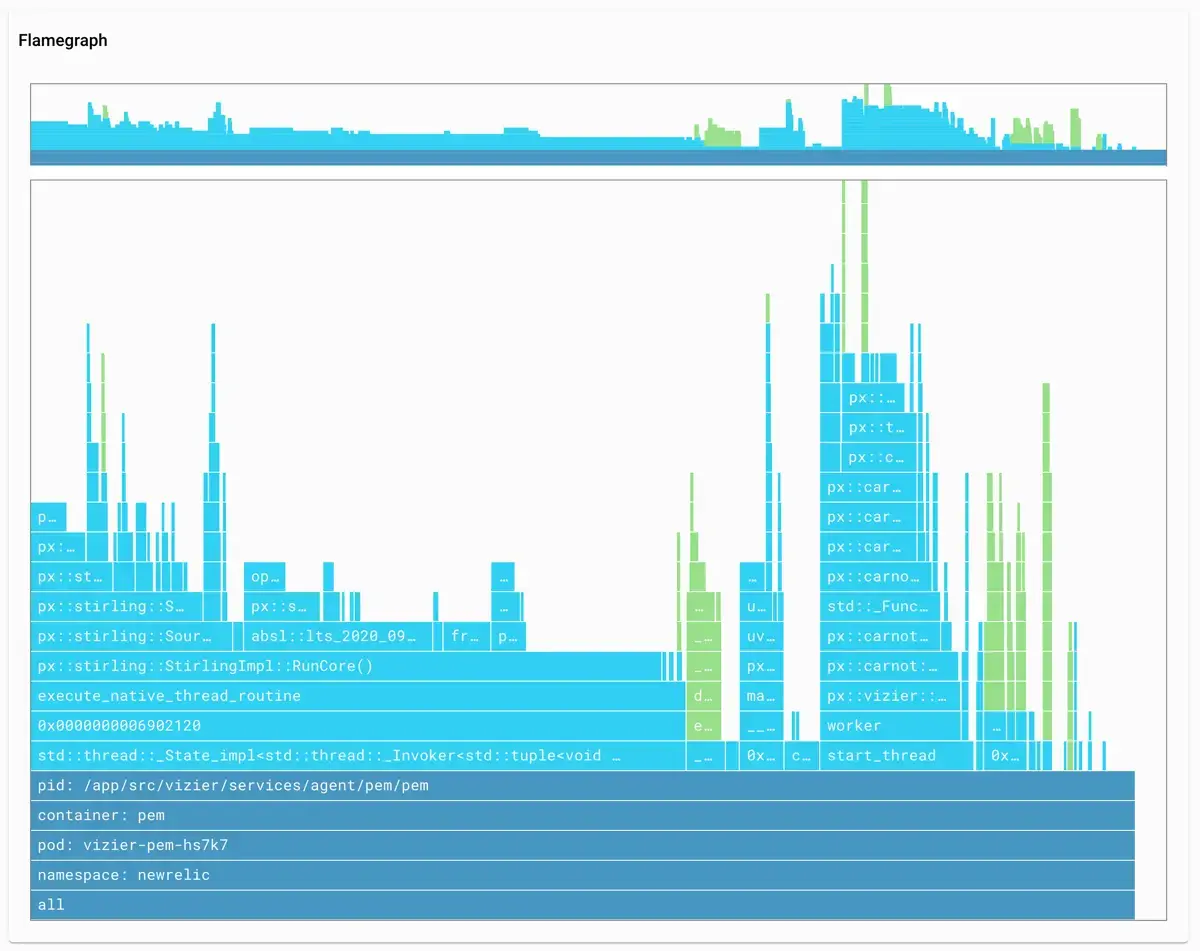
Use Pixie to see CPU flamegraphs for your Kubernetes pods.
On the Live debugging with Pixie tab, answer questions like what SQL requests your app is making or which services are talking to each other.
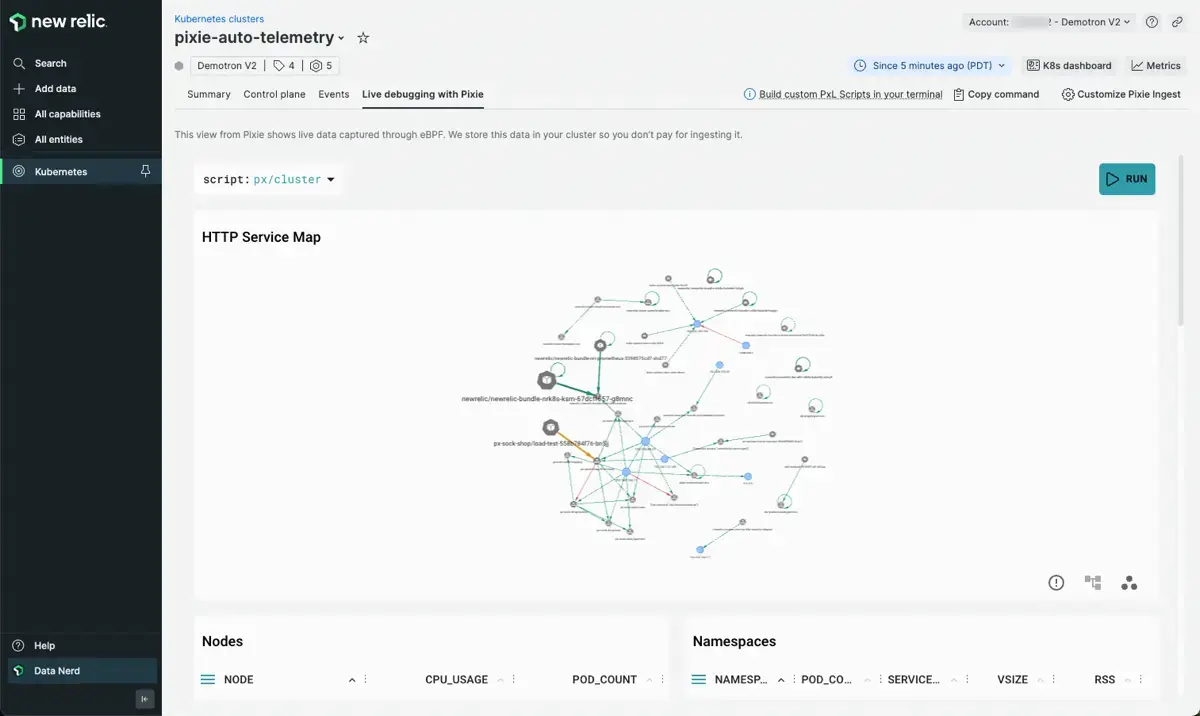
Run scripts in the Live debugging with Pixie tab to debug your Kubernetes applications.
This short video (approx. 6:20 minutes) shows how Pixie and Kubernetes work together so you can debug faster with code-level insights:
To learn more about debugging with Pixie, see the Understand and use Pixie data section.
Our commitment to open source
New Relic is committed to open standards, open source instrumentation, and the open communities that support them.
As a step towards making observability open for everyone, New Relic contributed Pixie to the Cloud Native Computing Foundation as a Sandbox project in June 2021. Meet the New Relic employees who contribute to the Pixie project.