Use New Relic to analyze and store the ingested logs from your Vercel projects and traces from your serverless functions.
You can install the Vercel quickstart to get a pre-built dashboard and alert to monitor the performance of your functions.
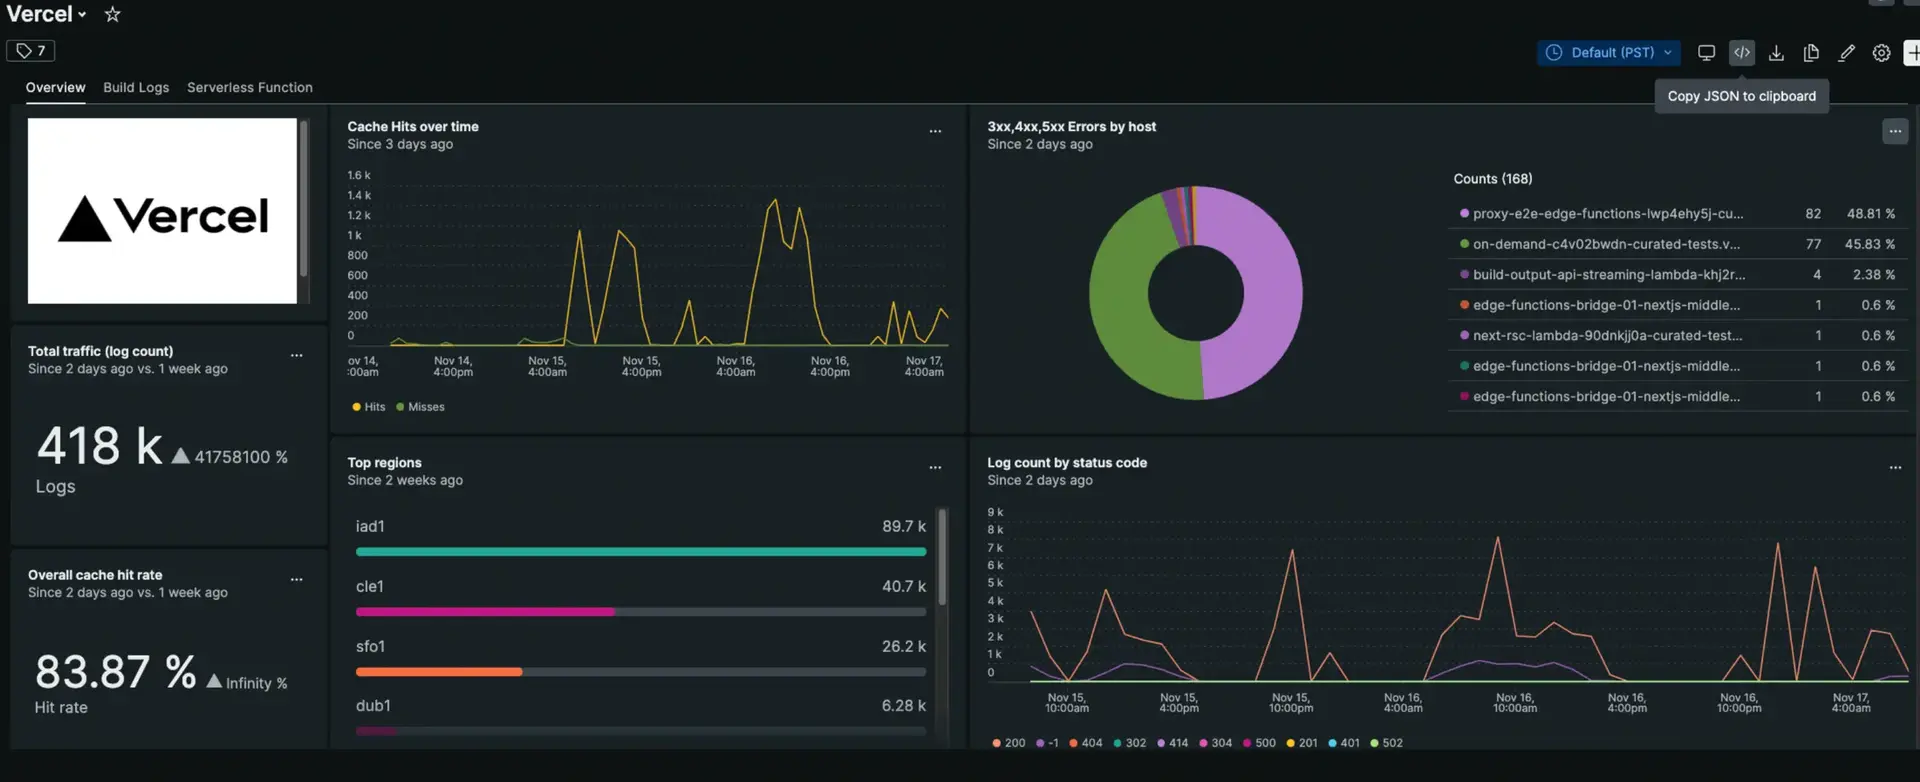
Once you have installed the Vercel quickstart, go to one.newrelic.com > All capabilities > Dashboards > Vercel to see your Vercel dashboard.
Prerequisites
To deploy on Vercel, you need to create a project which will group your deployments and custom domains. Learn how to set up and configure projects by reading the Vercel documentation.
Vercel configuration
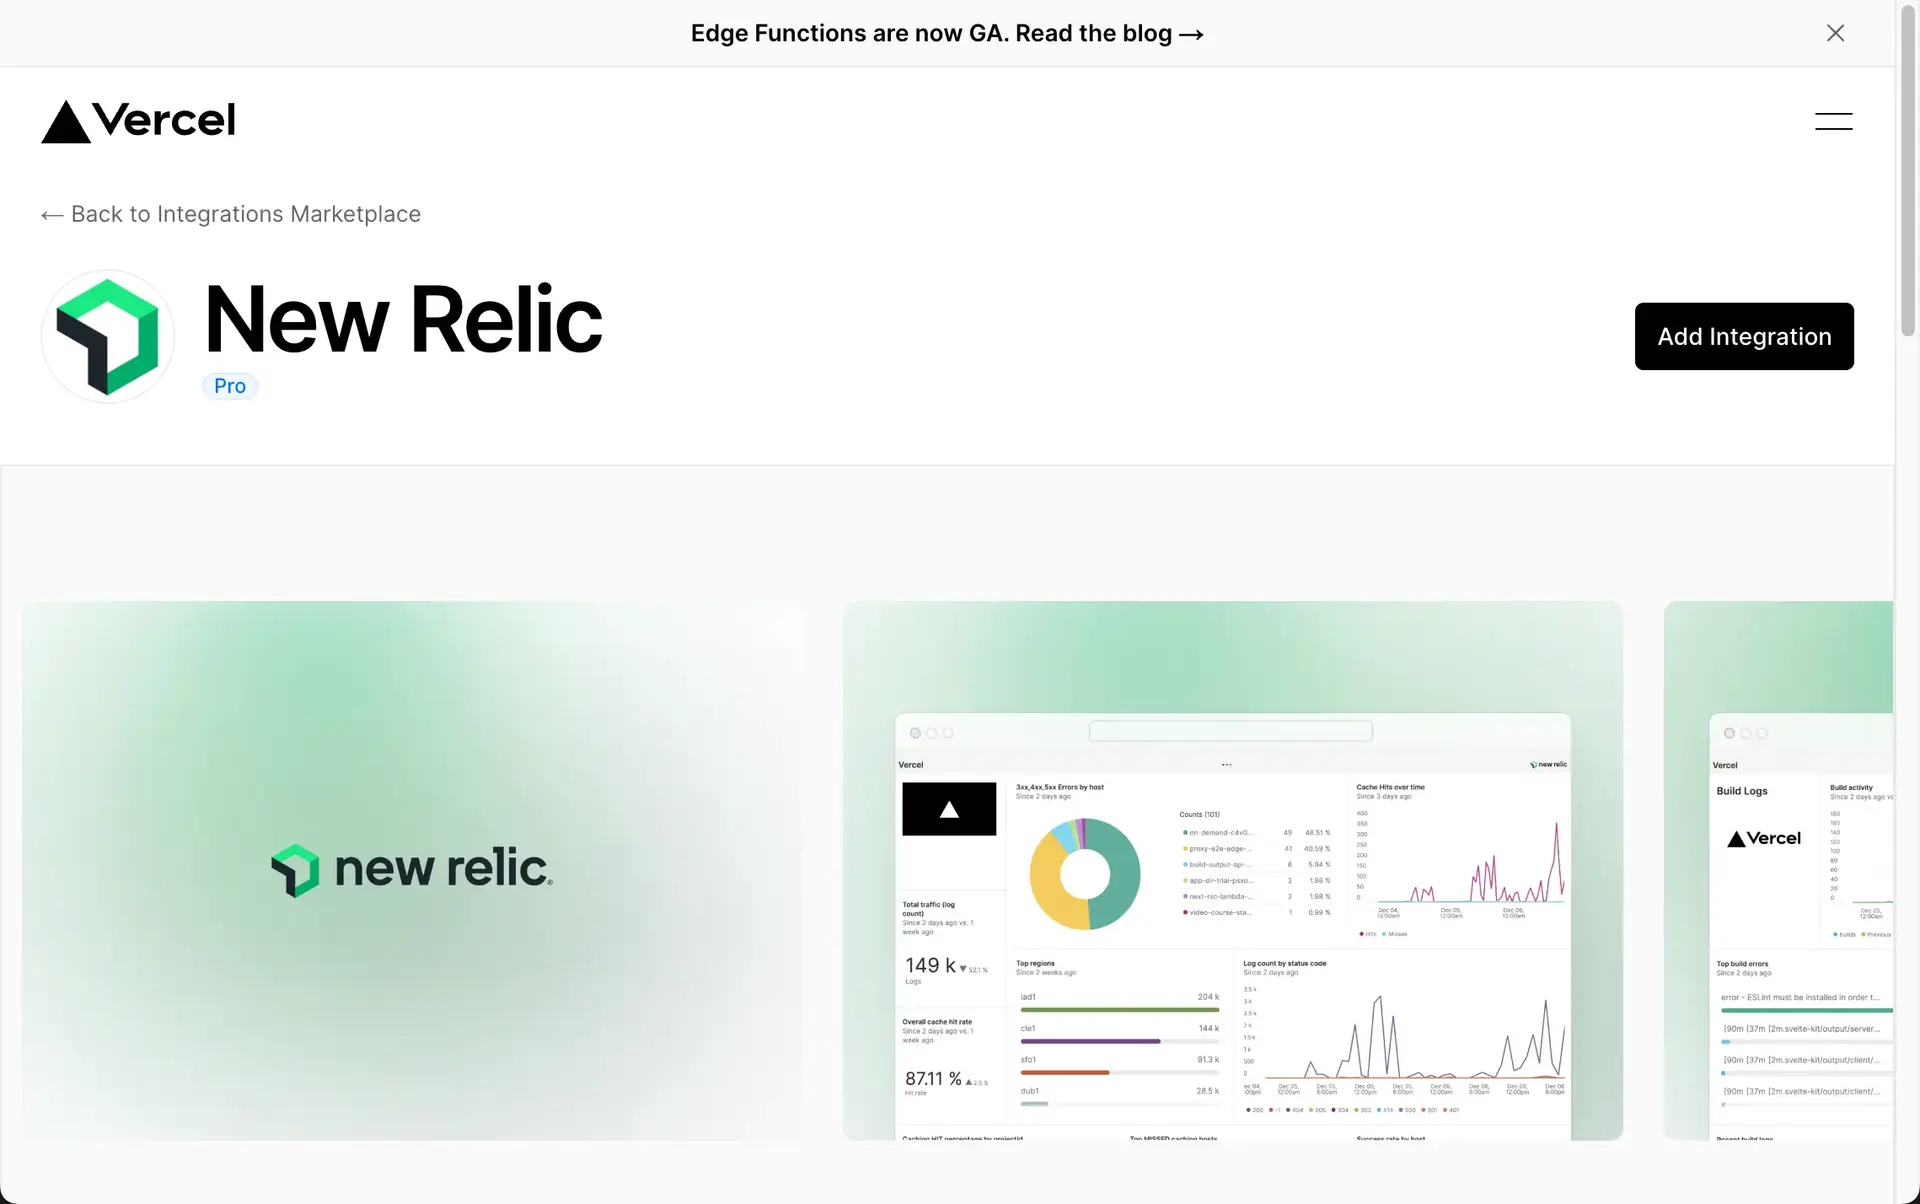
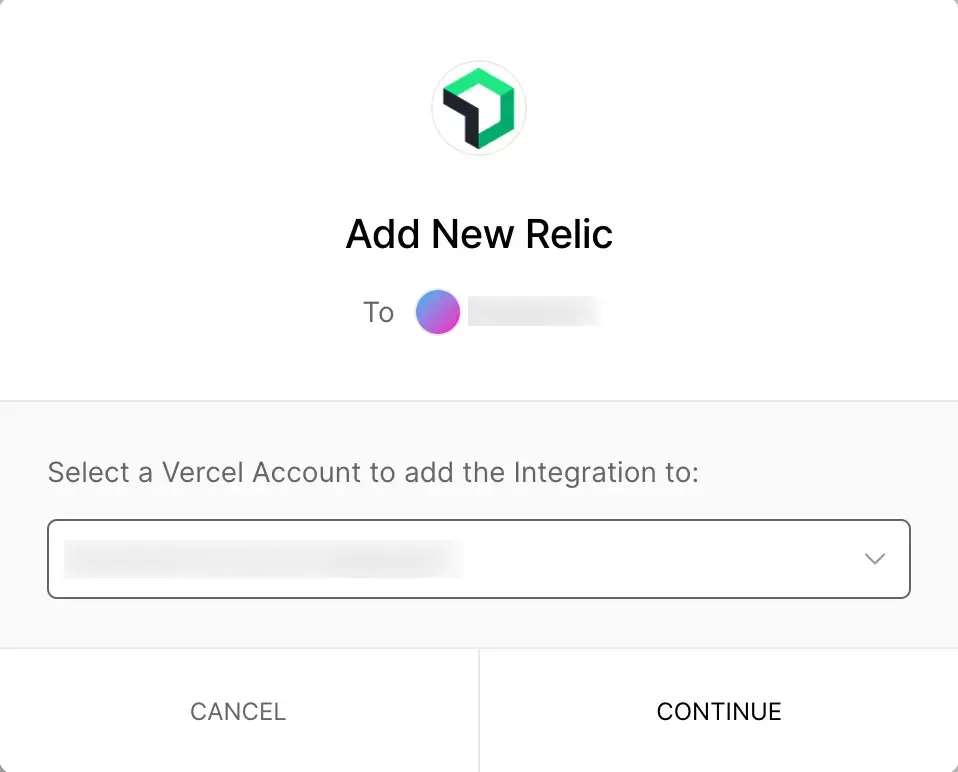
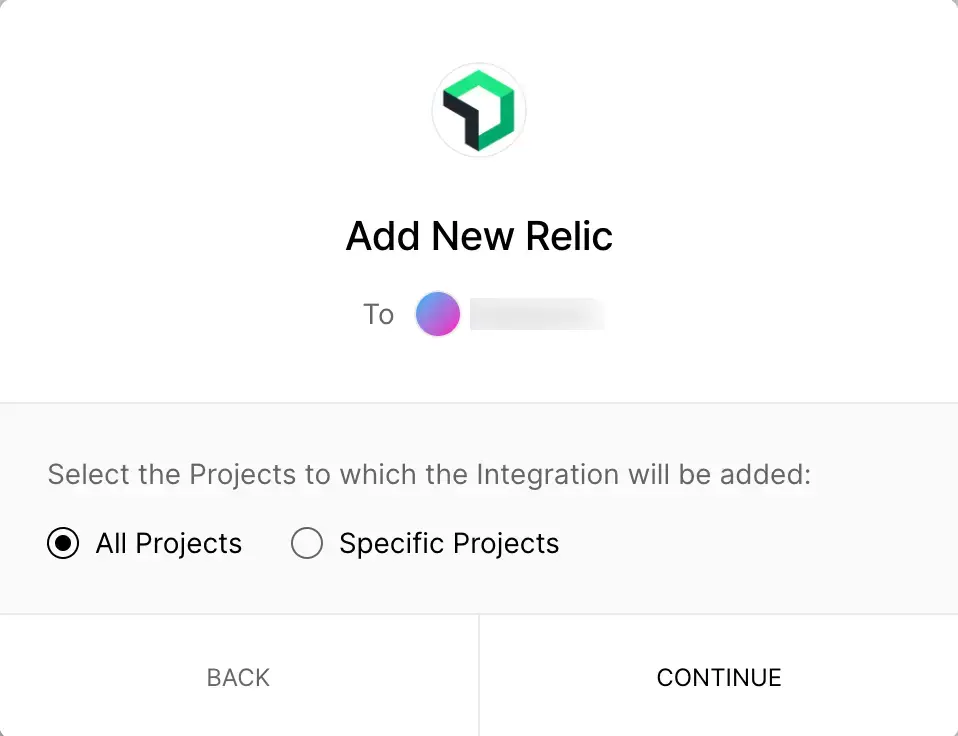
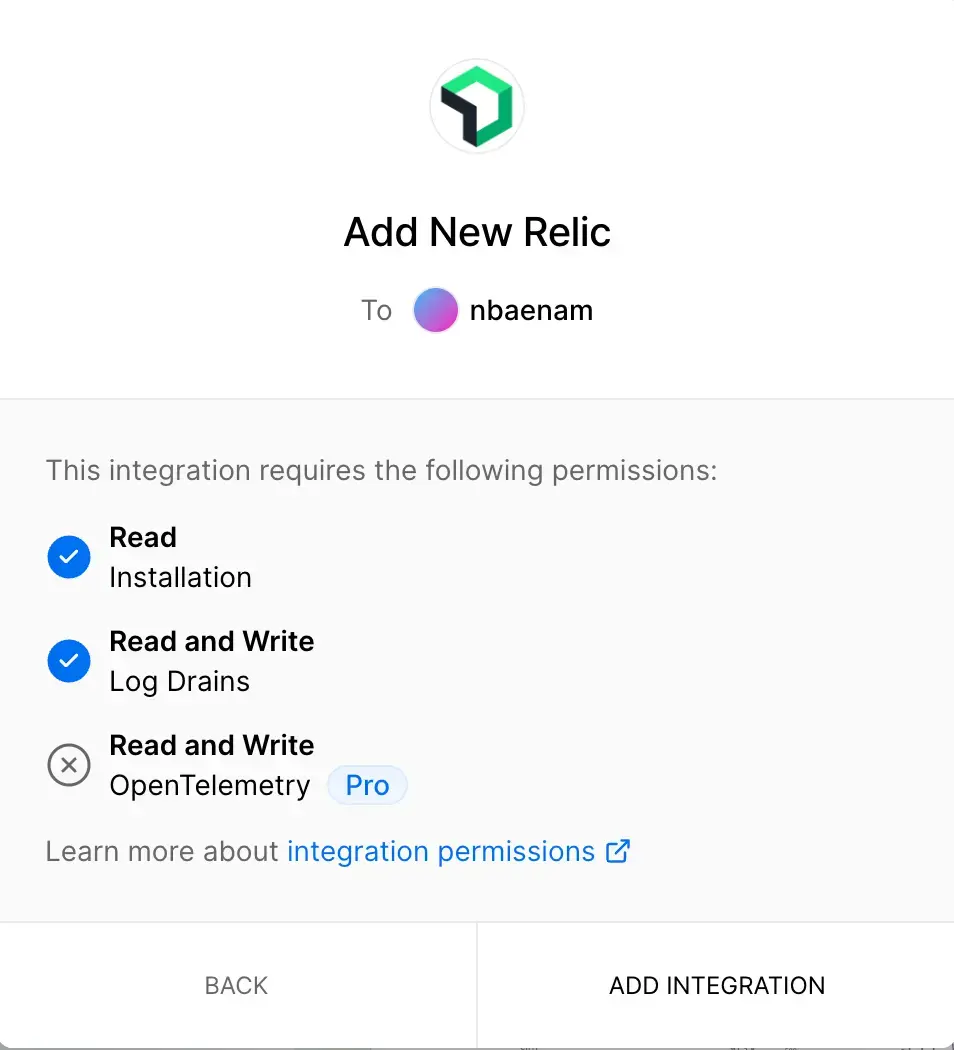
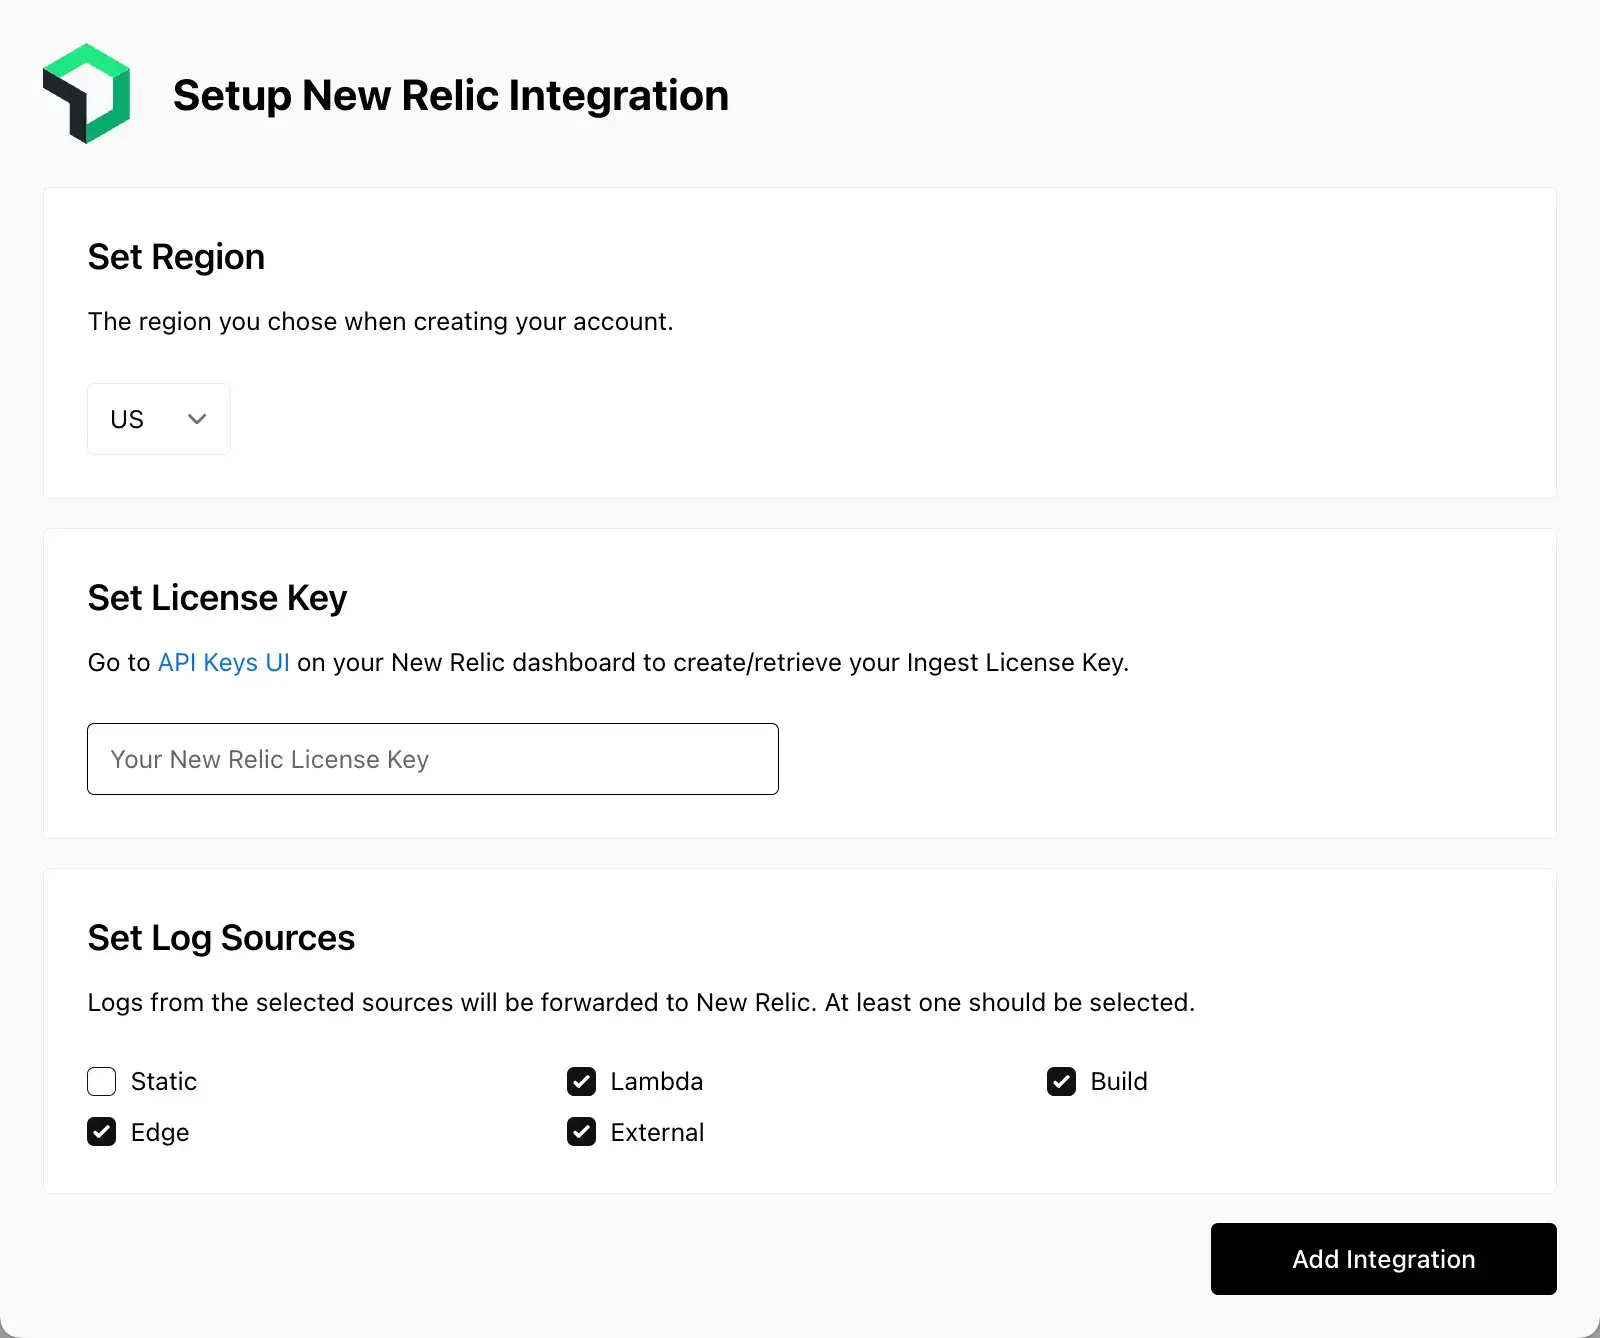
Follow these easy steps to integrate your Vercel project and start sending logs:
Install the Vercel quickstart dashboard
After you've sent Vercel data to New Relic, the Vercel quickstart is the fastest way to jump straight into monitoring your end-to-end development logs.
Install the quickstart to get a pre-built dashboard and alert to monitor the performance of your functions. You'll also get a pre-built alert that triggers when the error rate (4xx/5xx errors) exceeds 1%. Follow these instructions:
- Go to the Vercel quickstart in New Relic Instant Observability and click Install now.
- Select an account and click Begin installation.
- If you've already completed the Vercel configuration steps, select Done to move onto the next step.
- The quickstart deploys the resources to your account. Click See your data to get to the dashboard.
The Vercel quickstart dashboard visualizes all your key data into three pages. Click the Overview, Build Logs, and Serverless Function tabs to get an overview, analyze build logs, and dive deep into your Serverless Function performance.
Optional: Get trace data from Vercel with OpenTelemetry
You can use OpenTelemetry to import trace data from your applications running in Vercel functions. To set this option, follow these steps:
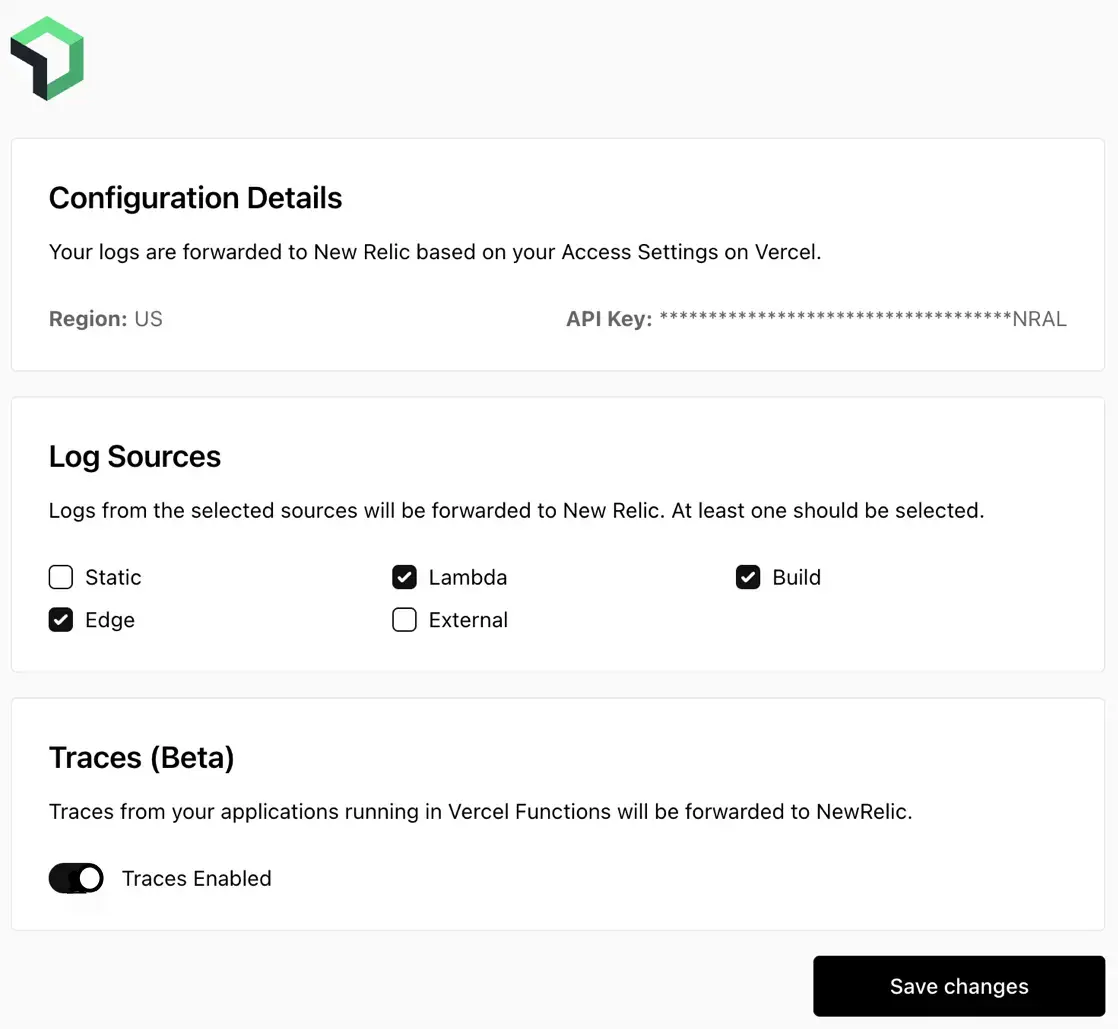
After clicking Add integration in step 5 in the Vercel configuration, you'll see the configuration details dialog box.
Go to the Traces (Beta) section and toggle it on to enable the traces.
Click Save changes.
After you've enabled the traces, you'll see them in New Relic. Go to one.newrelic.com > All capabilities > APM & services > (select an app). Then, under the Monitor section, click Distributed tracing.
Disable log forwarding
To disable log forwarding capabilities, follow standard procedures in the Vercel documentation. You don't need to do anything else in New Relic.
