In Android mobile applications, an Application Not Responding (ANR) errors occurs when the main UI thread is blocked for more than five seconds. These errors significantly degrade the user experience and can be caused by several factors, including:
- Performing network operations on the main thread
- Running complex calculations that block UI updates
- Contending for shared resources
- Executing heavy I/O operations
By monitoring ANR errors provides valuable insights into your app's stability and the overall experience for your users.
How ANR errors are reported to New Relic
By default, the Android agent reports ANR errors as MobileApplicationExit events, which leverage Android’s ApplicationExitInfo API to monitor and report on the different causes for app termination. The agent reads the ApplicationExitInfo API on the next app launch and asynchronously sends MobileApplicationExit events to New Relic for each app exit in the history.
Understanding ANR discrepancies between New Relic and Google Play Console
You might encounter variations in ANR counts and rates between New Relic and Google Play Console. This is due to differences in data collection methods:
- Android version coverage:
- New Relic focuses on ANRs from devices running Android 11 or higher.
- Google Play Console captures ANRs across all Android versions.
- Device and app scope:
- New Relic reports from devices with the New Relic agent installed, regardless of app source.
- Google Play Console reports exclusively from certified devices with apps downloaded through the Play Store.
For more information, see the Google Play documentation.
View ANRs in New Relic
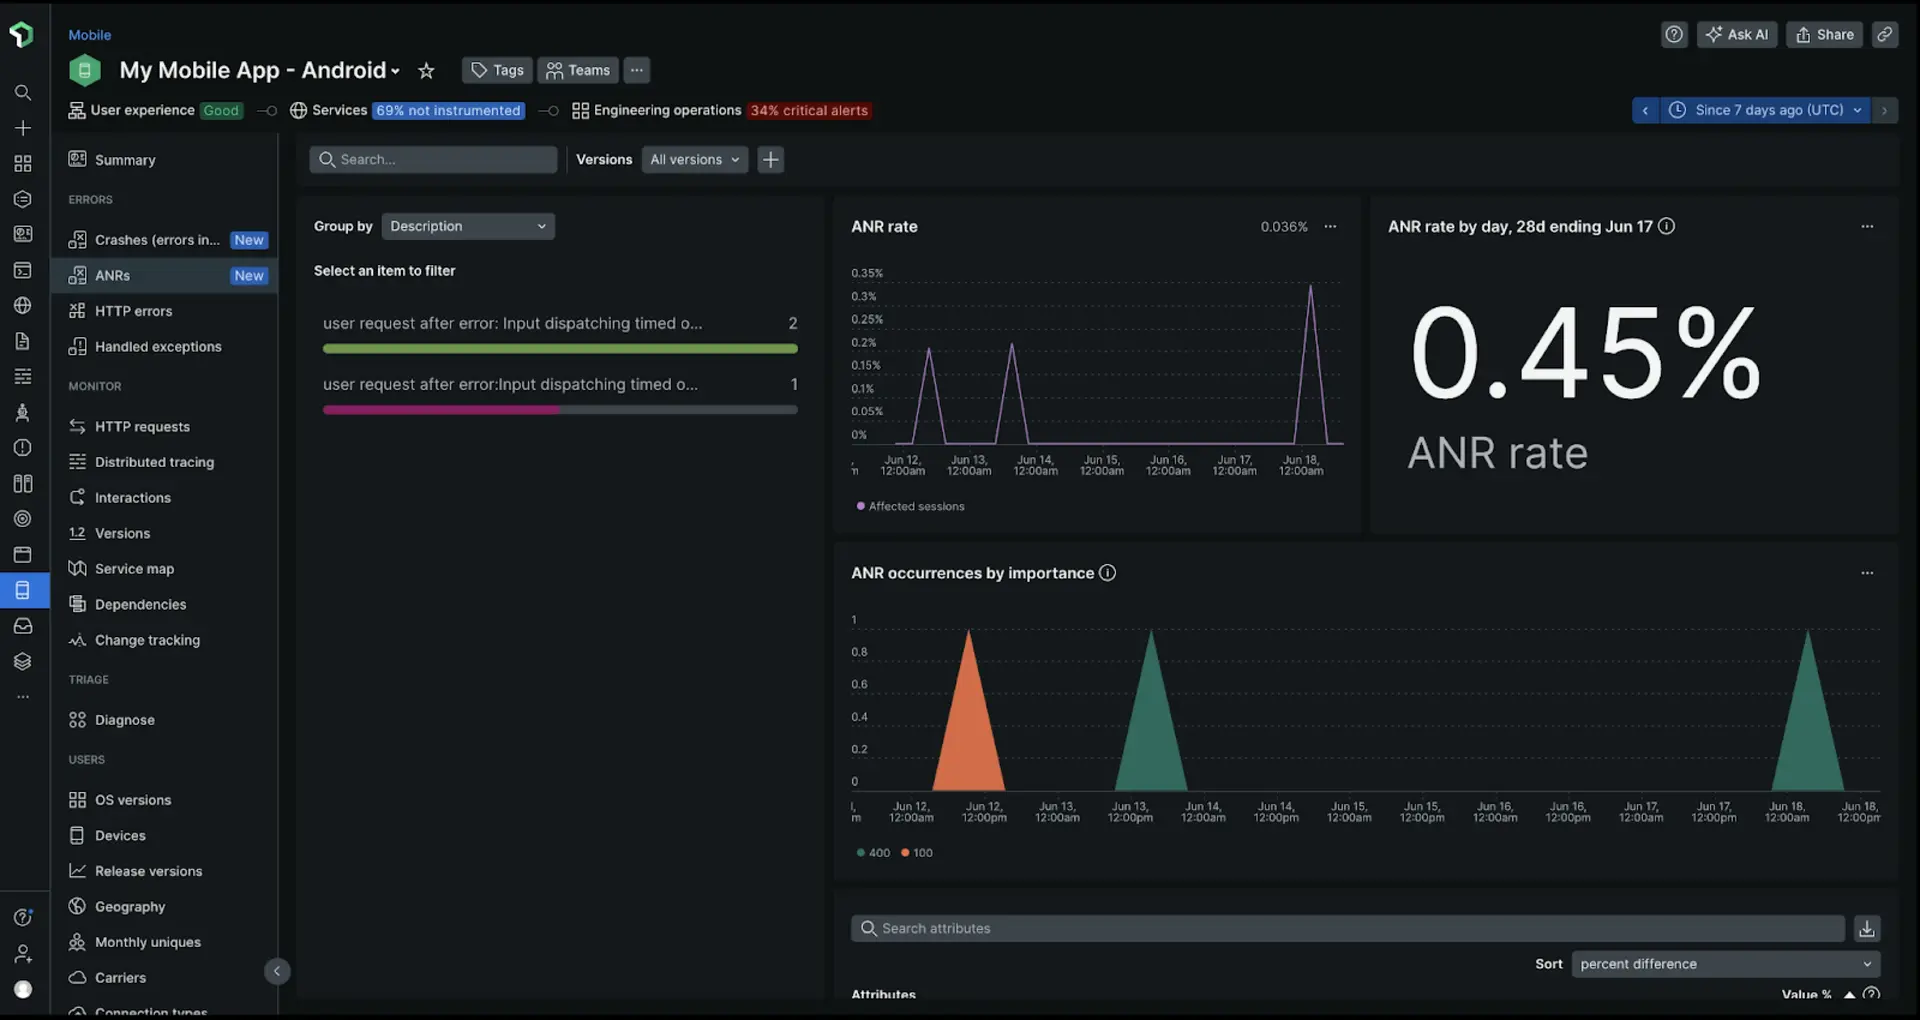
The ANRs page helps your development team to identify, analyze, and resolve ANR issues to deliver a more stable mobile experience.
This page enables you to:
Assess overall error trends: Review ANR rate charts by sessions and users to spot anomalies or patterns in ANR occurrences.
- ANR rate by session: Displays the percentage of sessions that experienced errors over time, broken down by app version. The average ANR session percentage is displayed in the upper left corner.
- ANR rate by users: Displays the percentage of unique users who experienced an ANR during a period, relative to the total number of unique users. Unique users are typically identified by a
deviceUuid.
Group and filter for deeper analysis: Group or filter ANR occurrences by attributes such as device type, OS version, app version, or any of the standard and custom attributes.
Identify patterns: Examine the ANR occurrences table to find trends related to the ANR description, such as ANR error message, occurrence date, frequency, app version, and the number of affected users.
Investigate individual ANR groups: Drill down into specific groups of similar ANRs to view detailed information, such as:
- Event trails showing user actions leading up to the ANR
- User journey information
- Representative stack traces
- Associated attributes and metadata
You can export stack traces to your local machine and use Android symbolication tools to deobfuscate them for more in-depth analysis.

To view the ANRs page:
- Go to one.newrelic.com > All capabilities.
- Click Mobile.
- Select an Android app.
- In the left pane, click ANR.
ANR details view
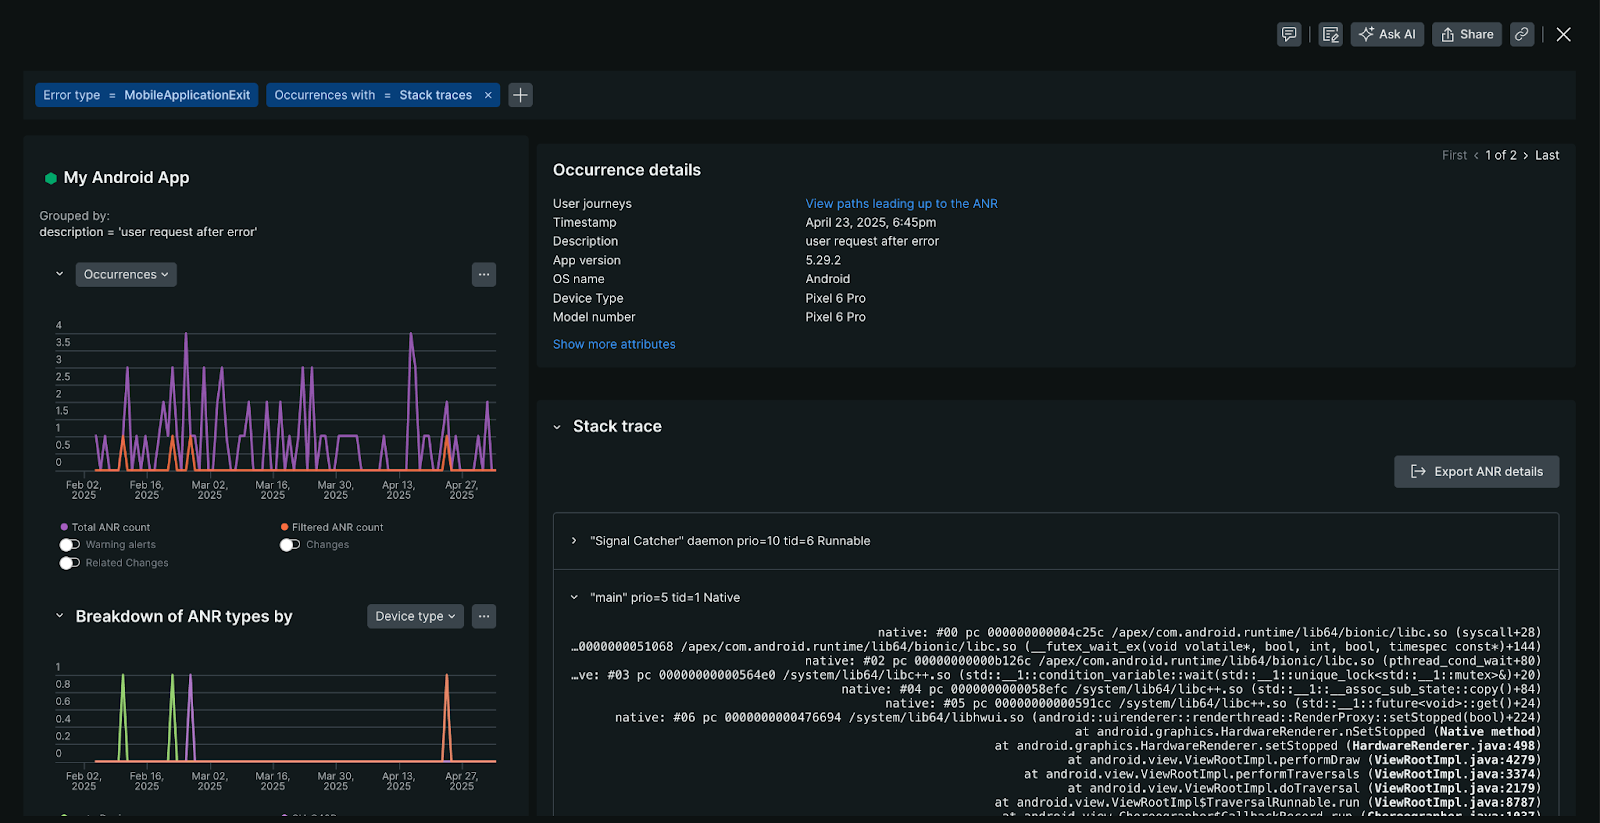
The ANR details view provides a comprehensive overview of the ANR occurrences, including:
- Occurrences chart: Displays the frequency of specific ANR over the selected period since its initial detection. If multiple occurrences are recorded, you can navigate through each instance.
- ANR type breakdown: Identifies patterns in device models or OS versions where this ANR appears most frequently.
- ANR attribute profiles: Identifies patterns and distributions across various dimensions for this specific ANR error group, such as app state (foreground/background), device characteristics, or geographic patterns correlating to this ANR error group.

To access the ANR details view, on the ANRs page, select an ANR occurrence.
ANR stack trace
When an ANR error occurs, the Android captures a stack trace. A stack trace is a snapshot of the code's execution path at the moment of the error. New Relic retrieves these stack traces using the Android ApplicationExitInfo#getTraceInputStream API method. If a stack trace is available, New Relic displays it below the ANR occurrence details.
Availability:
- Stack trace data for ANRs requires New Relic Android agent version 7.6.2 or later.
- An ANR occurrence will not include a stack trace if the
ApplicationExitInfo#getTraceInputStreammethod returnsnull.
Deobfuscation:
New Relic automatically symbolicates Java stack frames in ANR stack traces, providing readable method names and line numbers directly in the platform.
Note
Native (NDK) stack frames are not currently symbolicated. For native stack frames, you can download the stack trace from New Relic and use offline tools such as ndk-stack to symbolicate manually.
Disable ANR monitoring
중요
Server-side configuration always take precedence over local agent configuration. For mobile apps with less than 100,000 concurrently active devices, it may take up to 10 minutes to apply changes to end-user devices. For apps with greater than 100,000 active devices, it may take several hours.
If you need to disable ANR monitoring:
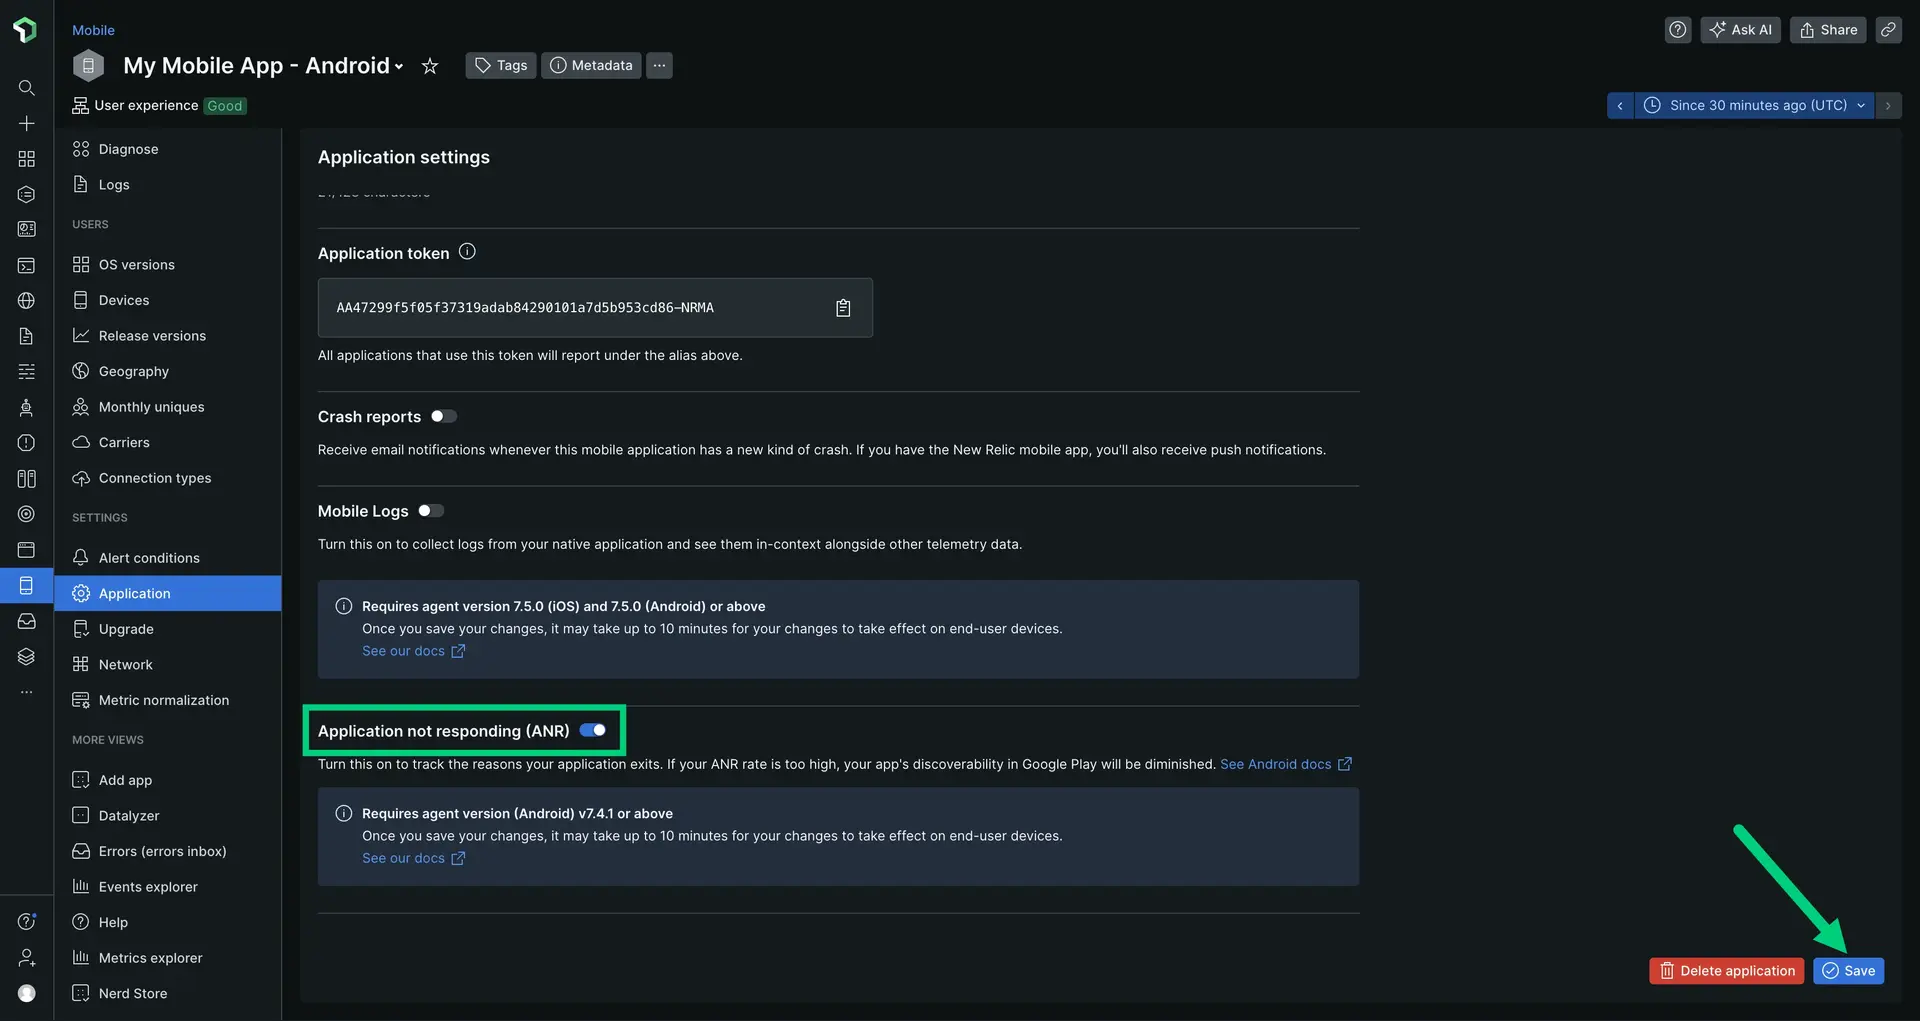
- In New Relic, navigate to your mobile app.
- In the left pane under Settings, click Application.
- Toggle Application Not Responding (ANR) off.
- Click Save.
