The ability to manage and query vast amounts of data efficiently is one of the core capabilities of New Relic. We measure query output health the same as you might measure your client-facing capabilities: by how fast and error-free HTTP query requests receive responses. We refer to this as output performance, and you can measure SLIs to track this. Once you set up an output performance SLI using the procedure below, you can track both response times and the error rate of your applications.
Find your app
First, you'll need to make sure you've set-up the app you want to create the SLI for. If you can't find it, or haven't set it up yet, make sure that you do the following before continuing:
Instrument your primary applications with New Relic APM agents.
Name your applications with a familiar naming convention to make it easy to find.
Locate your application at one.newrelic.com > All entities.
Under All entities, find your application (entity type of
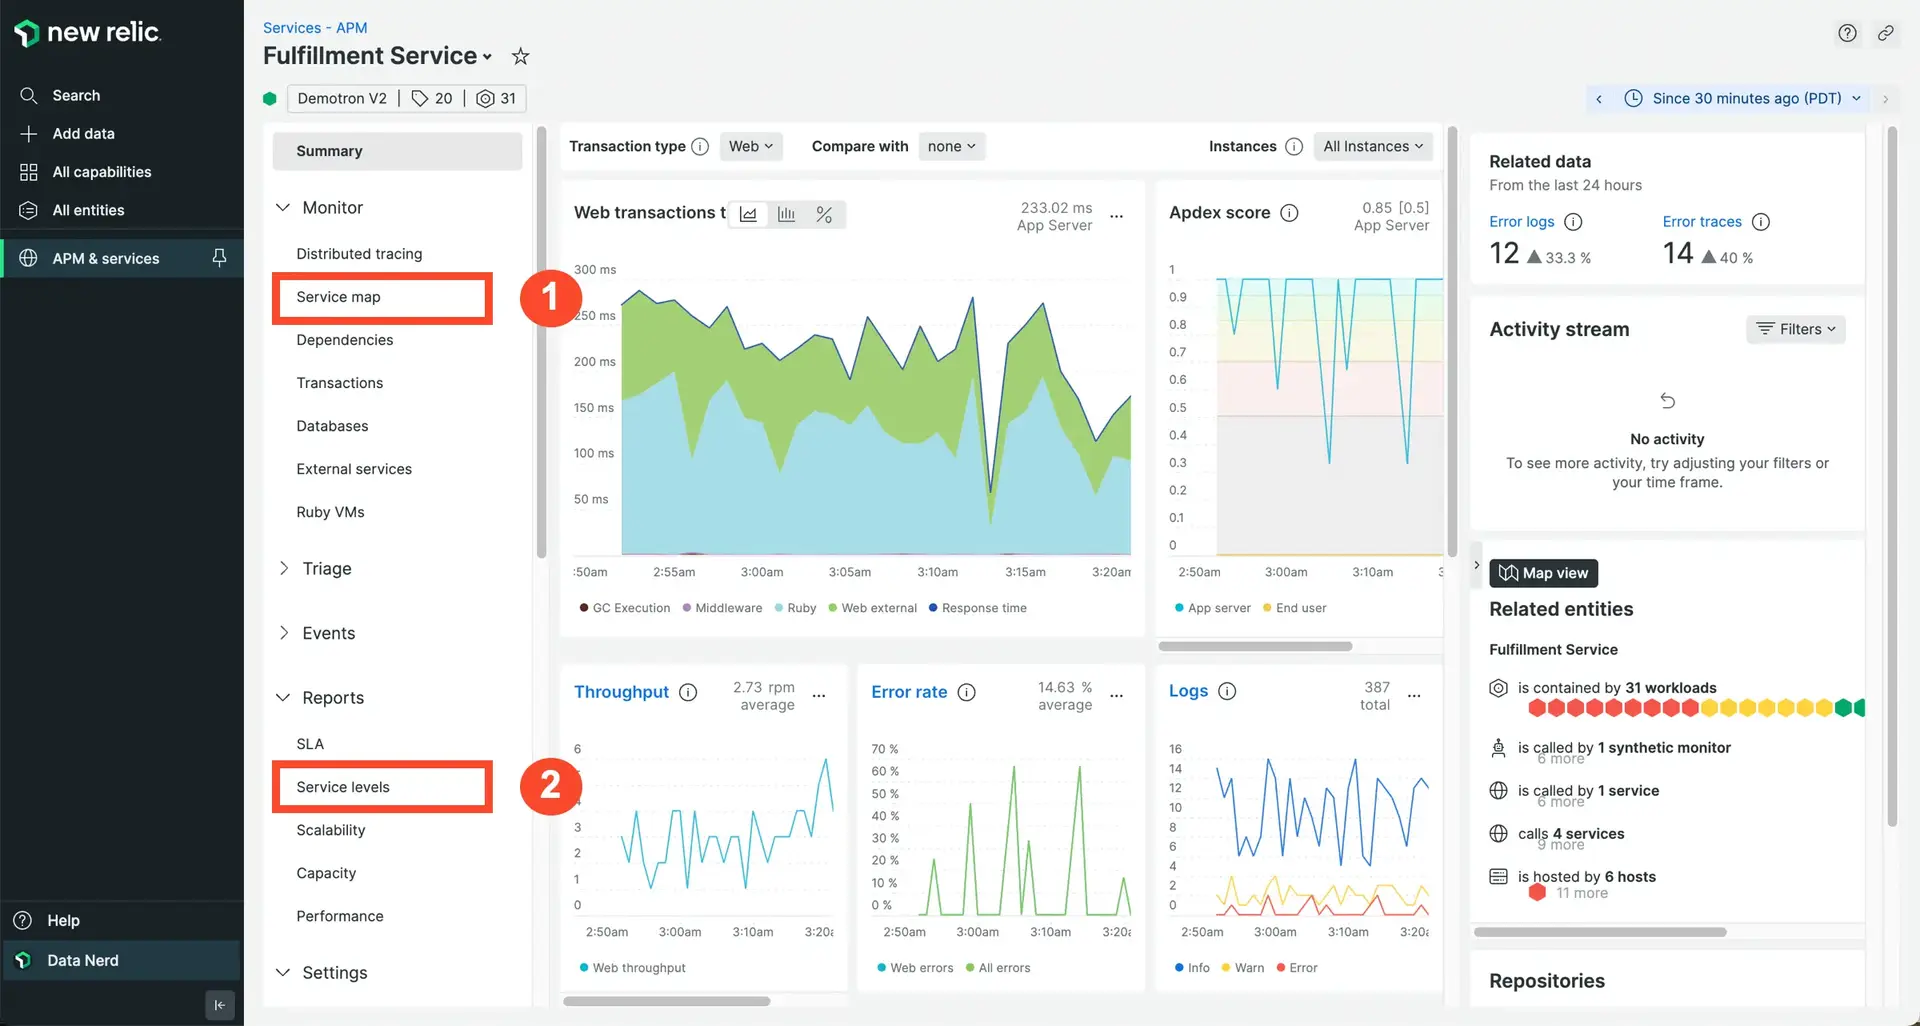
Services - APM) and select it. You should see the overview screen below, but don't clickService levelsyet.
Identify your service boundary
Next, you'll want to ensure you're measuring the output of your service. While the dependencies of an application each play a part in response times and success rates, you can measure the final and total response times and success rates at the point where the request is received and responded to.
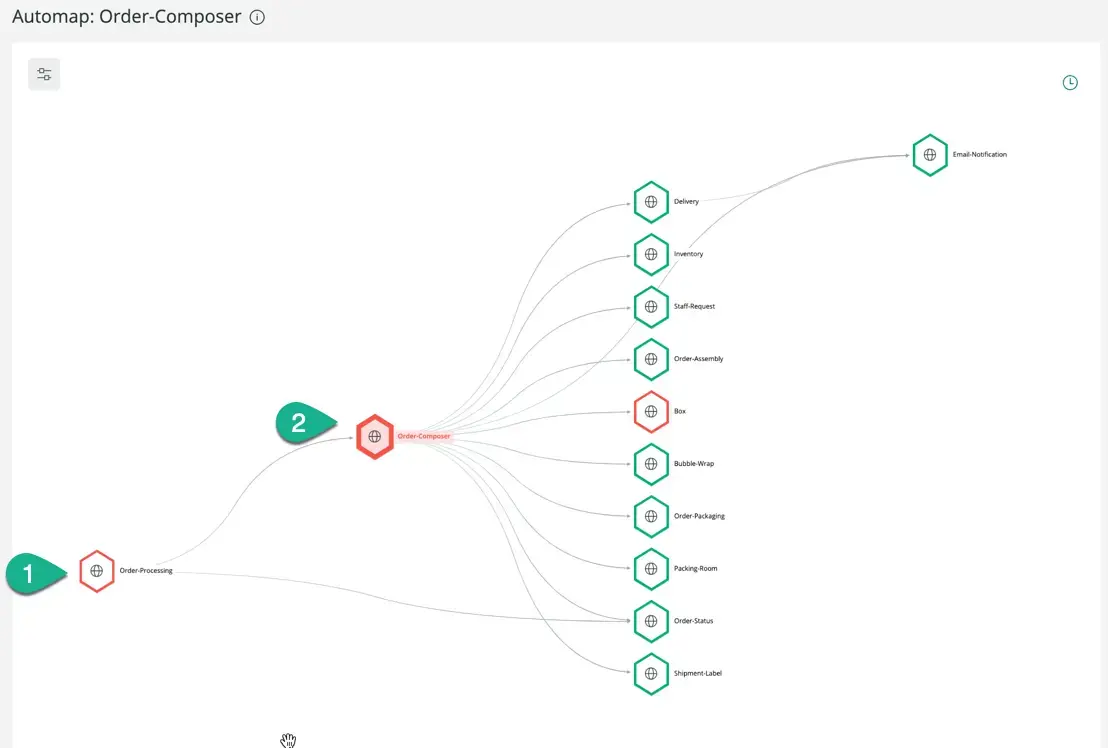
You can use service maps and automaps to help determine if the application you're looking at is a dependency or runs the endpoint API.
In the screenshot example below, you can see all applications that support order processing. We start with selecting #2 (Order-Composer). Then, we click Service maps and discover that Order-Composer is really a dependency. You'll need to select #1 (Order-Processing) in order to establish a true health service level.

팁
Your team may only be accountable for the Order-Composer dependency. If so, then your own service level on Order-Composer can self-monitor the performance. Ensure you tag your own non-customer facing service levels as customer-facing:false to allow for better filtering in health reports. Also, consider working with the customer-facing endpoint (#1 Order-Processing) during observability to create true output performance, an input connectivity service level, and client service levels.
Create your baseline
When you create service levels, you should first look at the output performance of your application as a baseline, which you must establish to implement service levels. Creating a baseline allows you to measure the performance of a service as a point of reference, then use service level reports to find out whether or not you're hitting that baseline. You can create a baseline for almost any dataset; however, you use different formulas and recommendations in different use cases.
You can use response times (latency) and percentage of non-errors (success) as starting baselines. When you do this, you create a reliability health metric.
We recommend a history of one to two weeks of performance data to establish a good baseline. Seasonality and peak usage shouldn't handicap your performance, and the more history you include in your measurement, the more likely you're including different codebases from releases. Previous deployments, no matter how small, could skew your results.
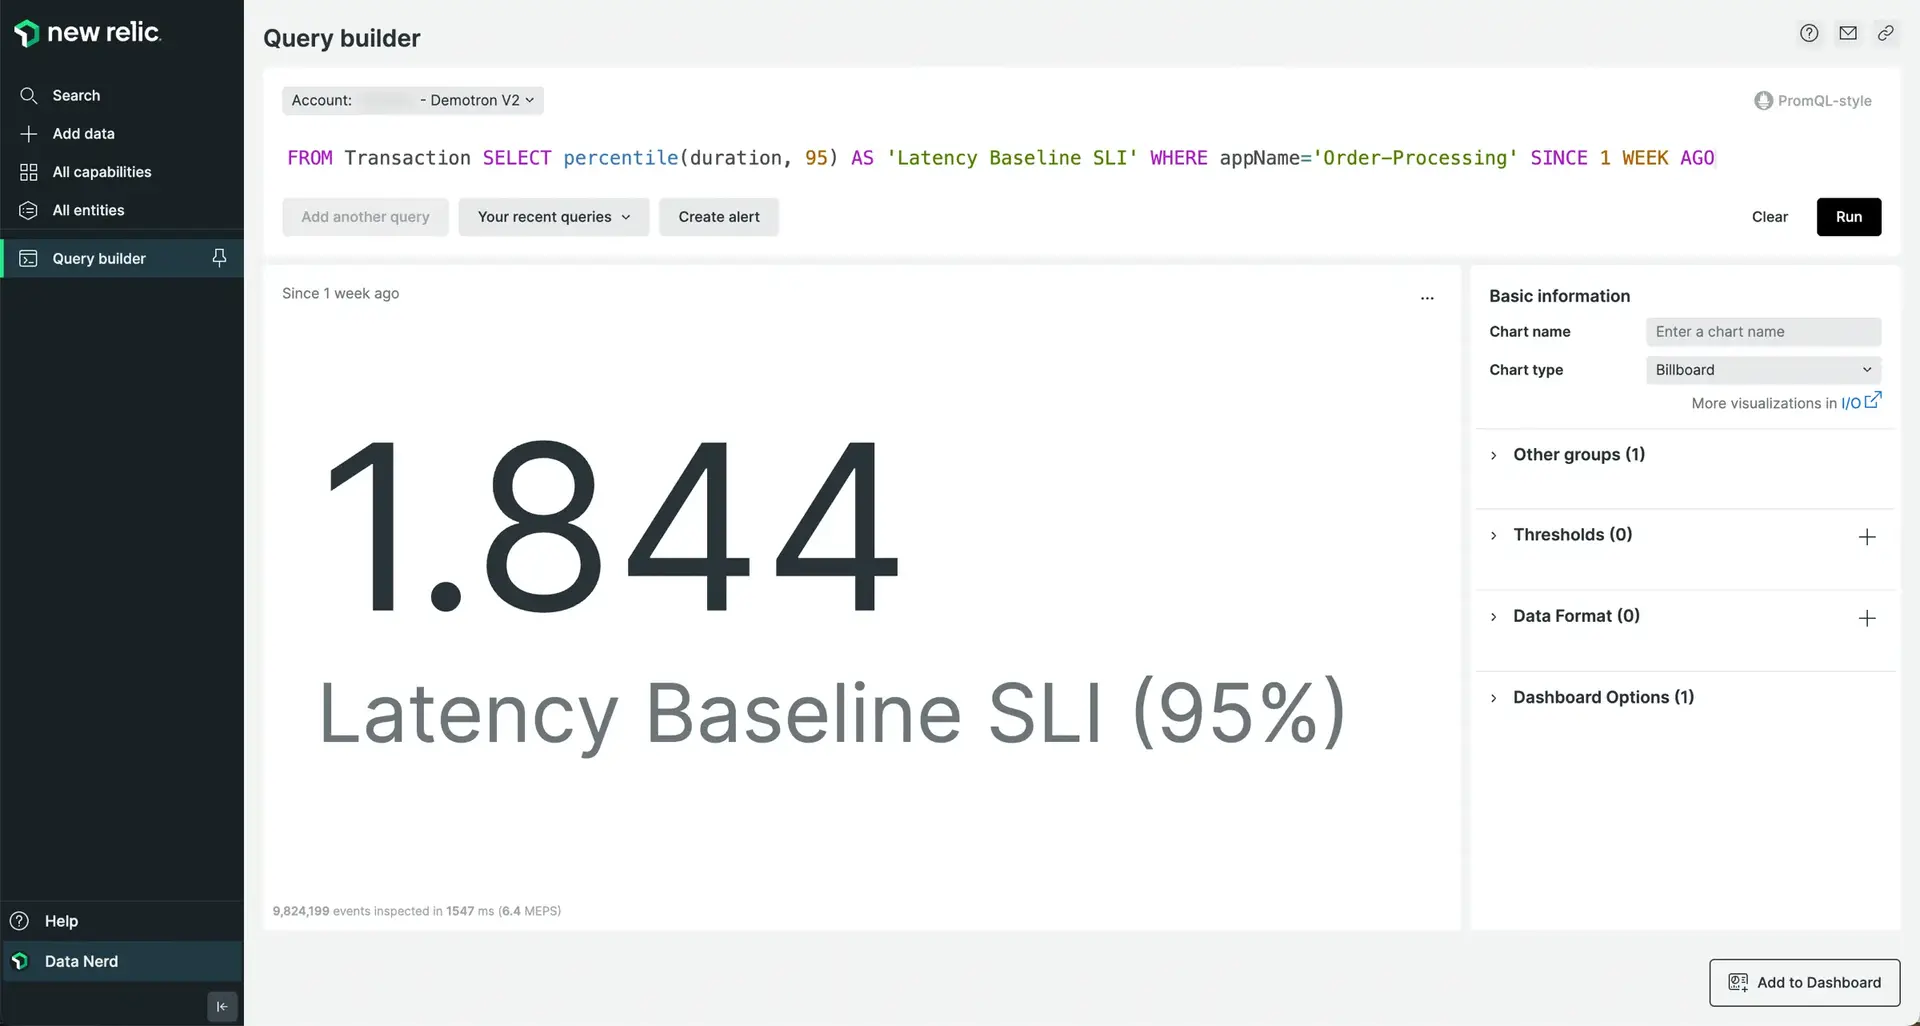
Here's an example NRQL query for the recommended target of a seven day service level objective for latency:
FROM Transaction SELECT percentile(duration, 95) AS 'Latency Baseline SLI' WHERE appName='Order-Processing' SINCE 1 WEEK AGO
For a successful (error-free) baseline, try the following query. Remember to substitute Order-Processing for your own application name.
FROM Transaction SELECT percentage(count(*), WHERE error is false) AS 'Success Baseline SLI' SINCE 1 WEEK AGO WHERE appName='Order-Processing'Create your service level
Note: If you don't see the Add a service level button, check with your New Relic administrator about your permissions.
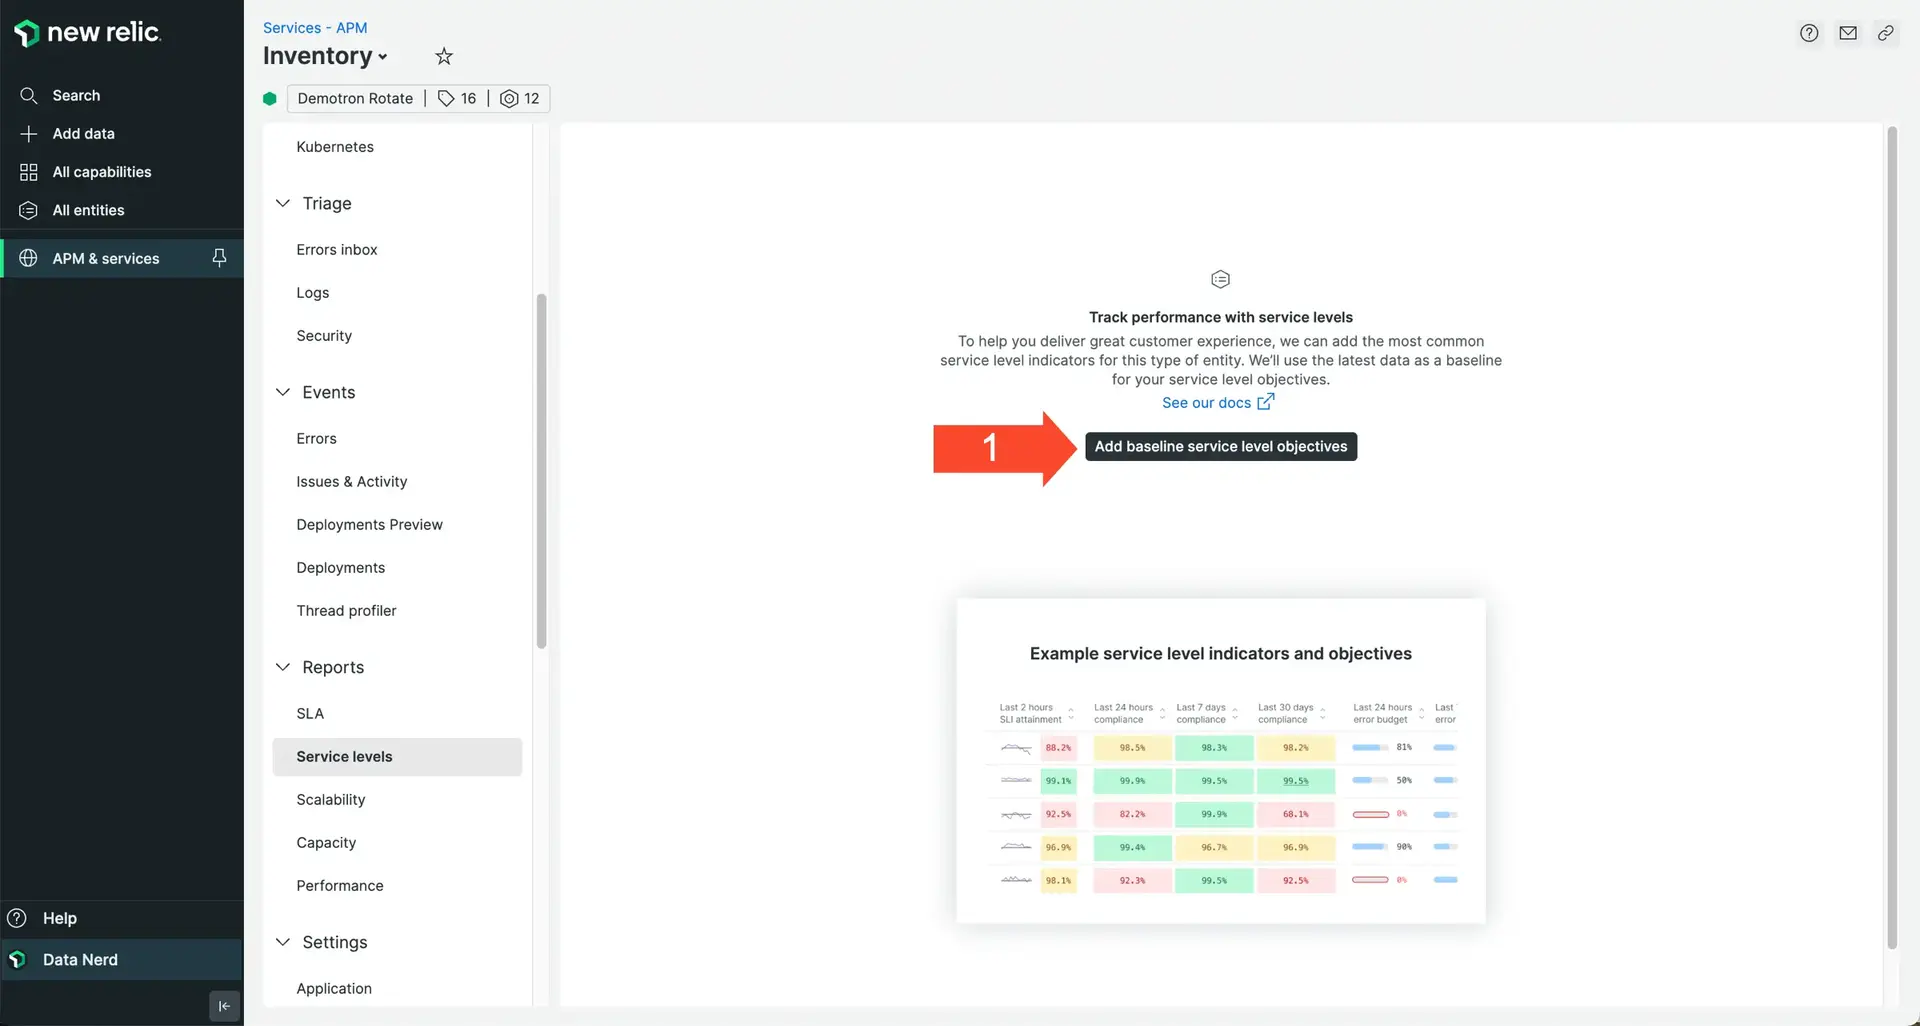
Our platform automatically calculates the recommended and browser baselines for you. Find your application APM data that you chose in Step 2 and click Service levels, and you should see the view below:

Click Add baseline service level objectives to create both your latency SLI and success SLI, as well as their respective objectives. You can view and change all the settings by clicking the ellipses icon in the upper-right corner of each SLO scorecard.
팁
It takes approximately 10 minutes for data to populate the SLO scores because we use the events-to-metrics service for data longevity and query performance. It takes a moment for the conversion to take place and begin to populate the data.