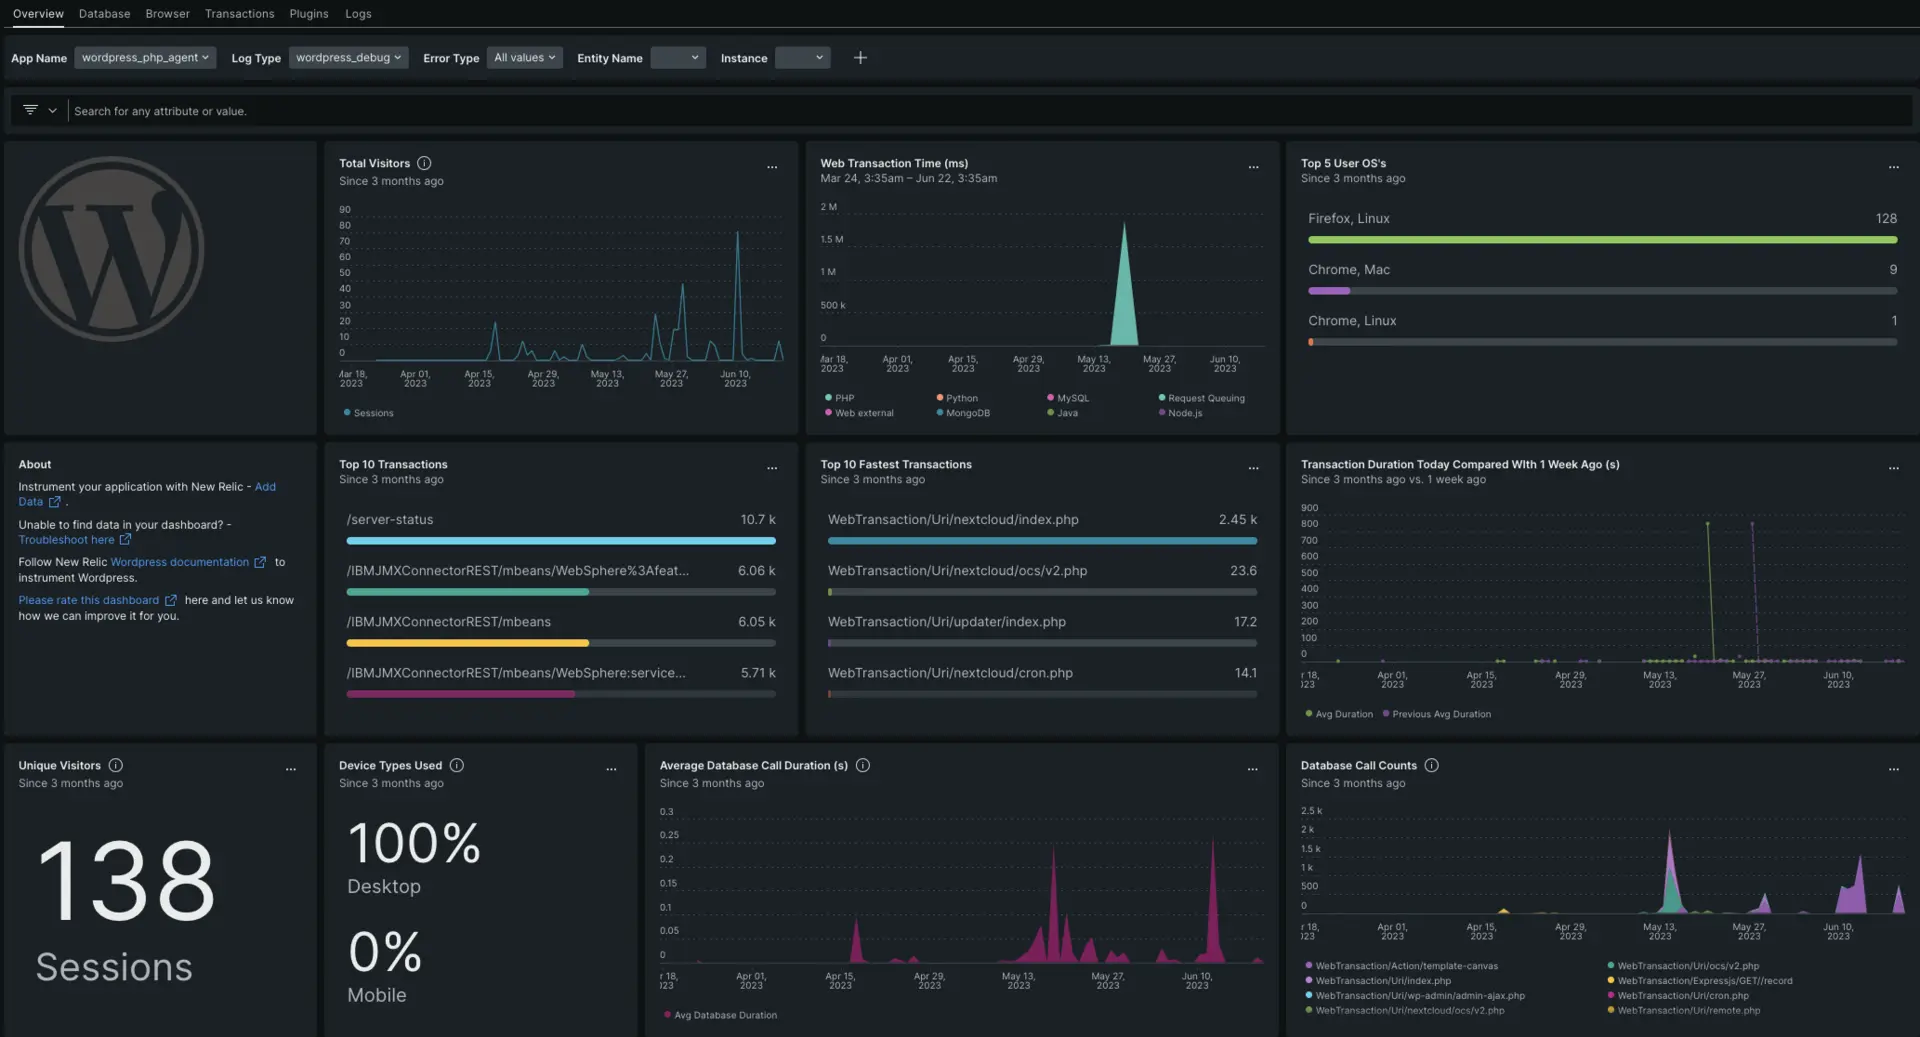
Our WordPress integration monitors the performance of your WordPress web application, helping you diagnose issues in your application and optimize your code. Our WordPress integration makes use of our PHP, Apache, and MySQL integrations, and gives you a pre-built dashboard with your most important WordPress metrics like transactions, visitors, and call duration.

After setting up our WordPress integration, we give you a dashboard for your WordPress metrics.
Install
Install the infrastructure agent
You can install the infrastructure agent two different ways:
- Our guided install is a CLI tool that inspects your system and installs the infrastructure agent alongside the application monitoring agent that best works for your system. To learn more about how our guided install works, check out our Guided install overview.
- If you'd rather install our infrastructure agent manually, you can follow a tutorial for manual installation for Linux, Windows, or macOS.
Install the PHP agent
- Check out our PHP agent requirements before installing the agent.
- Open the PHP quickstart installation.
- Click Install now to start the PHP agent installation.
Install the MySQL quickstart
- Check out our MySQL requirements.
- Open MySQL quickstart installation.
- Click Install now to start the MySQL agent installation.
Install the Apache quickstart
- Check out our Apache requirements.
- Open the Apache quickstart installation.
- Click Install now to start the Apache agent installation.
Configure NRI-Flex for WordPress
Flex comes bundled with the New Relic infrastructure agent. To create a flex configuration file follow these steps:
Create a file named
read-wordpress-files-config.ymlin this path:bash$/etc/newrelic-infra/integrations.dUpdate the
read-wordpress-files-config.ymlwith these details:INSERT_EVENT_TYPE. Anevent_typeis a New Relic database table that you can query using NRQL. An example ofevent_typewould beWPDirectoriesINSERT_WORDPRESS_PATH. Here, you need to enter the directory for your WordPress application, like:/srv/www/wordpress/*.
Use this configuration file:
integrations:- name: nri-flexinterval: 180sconfig:name: linuxDirectorySizeapis:- event_type: INSERT_EVENT_TYPEcommands:- run: du INSERT_WORDPRESS_PATHsplit: horizontalset_header: [dirSizeKB, dirName]regex_match: truesplit_by: (\d+)\s+(.+)
Configure WordPress to expose debug logs
Open your WordPress application and then open the
wp-config.phpfile.Update the file with the values listed below:
// Enable WP_DEBUG modedefine( 'WP_DEBUG', true );// Enable Debug logging to the /wp-content/debug.log filedefine( 'WP_DEBUG_LOG', true );Once you start your application, you will see a
debug.logfile in thewp-contentdirectory.
Forward WordPress debug logs to New Relic
You can use our log forwarding to forward WordPress logs to New Relic.
On Linux machines, your log file named logging.yml should be present in this path:
$/etc/newrelic-infra/logging.d/After creating the log file, add the following script to the logging.yml file:
logs: - name: wordpress-debug.log file: /srv/www/wordpress/wp-content/debug.log attributes: logtype: wordpress_debugRestart the infrastructure agent
Before you can start reading your data, use the instructions in our infrastructure agent docs to restart your infrastructure agent.
$sudo systemctl restart newrelic-infra.serviceIn a couple of minutes, your application will send metrics to one.newrelic.com.
Find your data
You can choose our pre-built dashboard template named WordPress Full Stack to monitor your WordPress application metrics. Follow these steps to use our pre-built dashboard template:
- From one.newrelic.com, go to the + Integrations & Agents page.
- Click on Dashboards.
- In the search bar, type
WordPress Full Stack. - The WordPress dashboard should appear. Click on it to install it.
Your WordPress dashboard is considered a custom dashboard and can be found in the Dashboards UI. For docs on using and editing dashboards, see our dashboard docs.
Here's an example NRQL query to check the delay for interaction to next paint (INP):
SELECT percentage(count(*),WHERE interactionToNextPaint < 200)AS 'Good (<100ms)', percentage(count(*),WHERE interactionToNextPaint >= 200 AND interactionToNextPaint < 500)AS 'Needs improvement (>=100 <300ms)', percentage(count(*),WHERE interactionToNextPaint >= 500)AS 'Poor (> 300ms)'FROM PageViewTimingWHERE interactionToNextPaint IS NOT NULLTIMESERIES AUTOWhat's next?
To learn more about querying your data and creating custom dashboards, check out these docs: