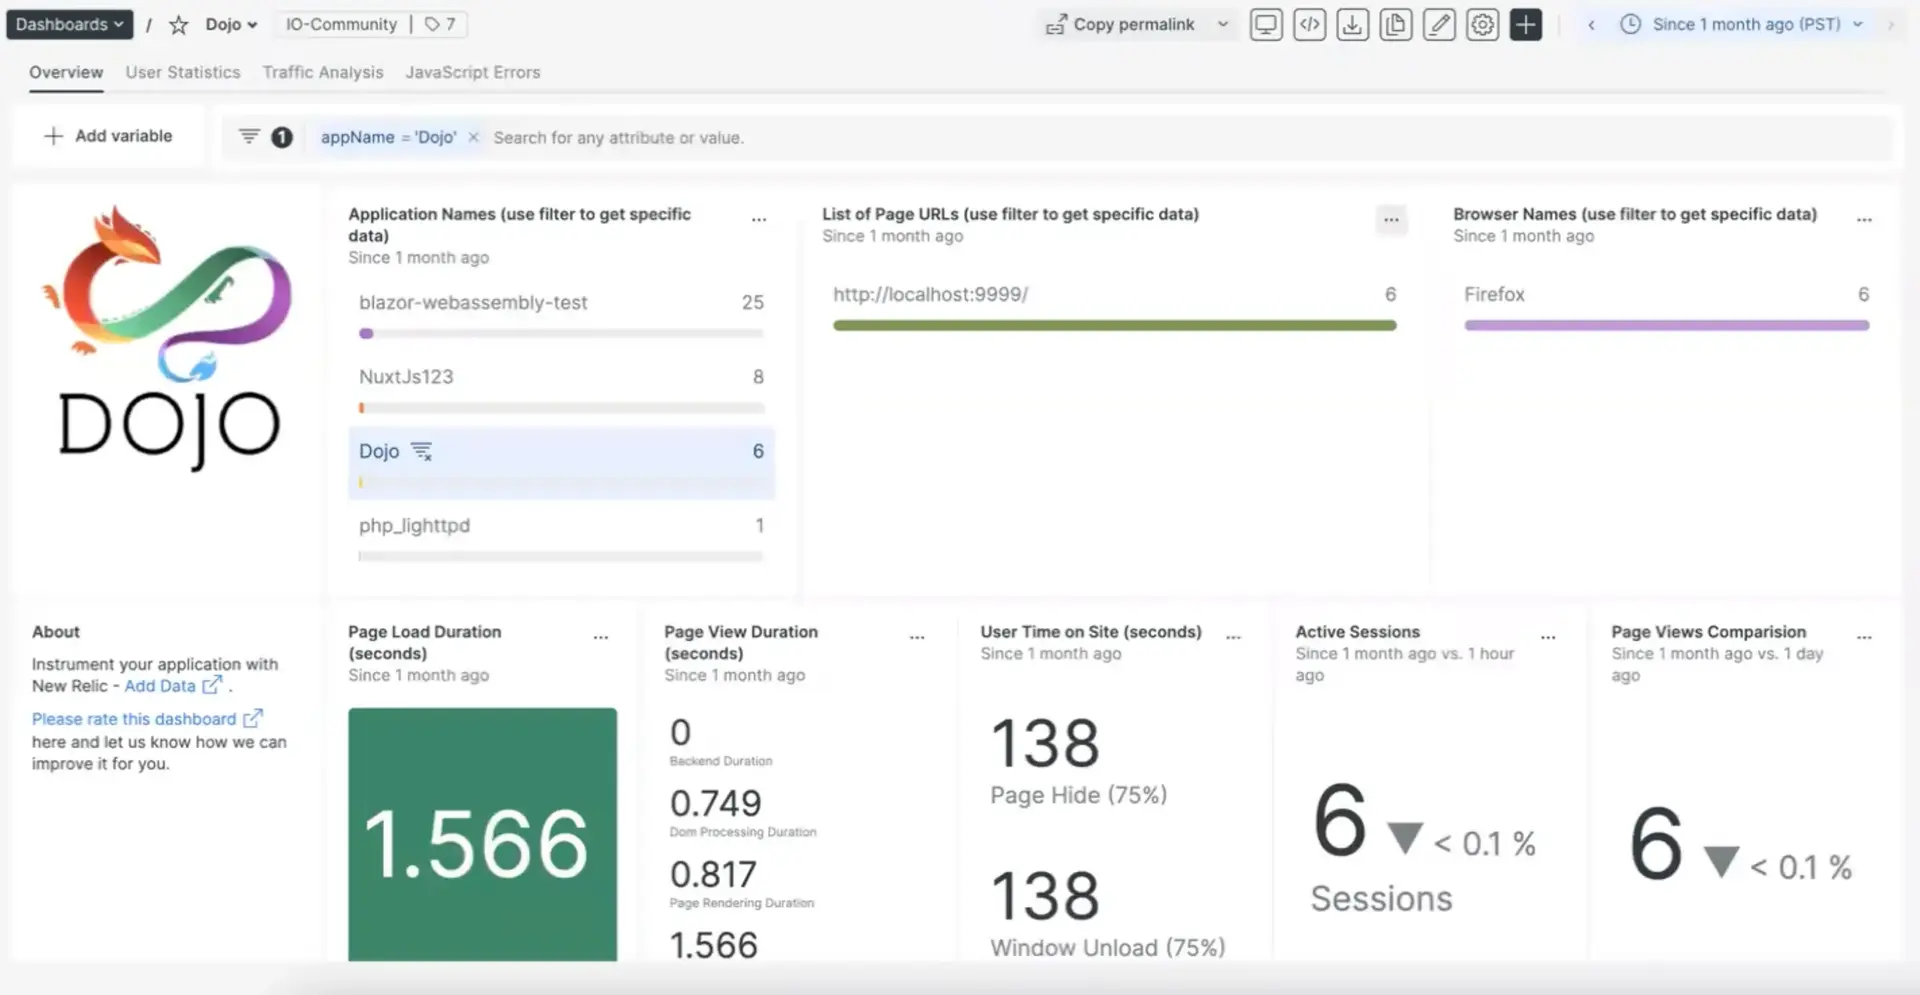
With the help of New Relic's Dojo dashboard, you can track your application's core web vitals, how much time your users spend on your site, and critical browser performance metrics like initial page load and pages with Javascript errors. Built with our agent, the Dojo dashboard lets you view all your most important data in one place.

Install the infrastructure agent (optional)
While our Dojo integration isn't built with our infrastructure agent, we recommend installing it if you want performance data about your hosts. You can install the infrastructure agent two different ways:
- Our guided install is a CLI tool that inspects your system and installs the infrastructure agent alongside the application monitoring agent that best works for your system. To learn more about how our guided install works, check out our Guided install overview.
- If you’d rather install our infrastructure agent manually, you can follow a tutorial for manual installation for Linux, Windows, or macOS.
Install the browser agent
- Install our browser agent by going to our install launcher and clicking Browser monitoring.
- Select your account and follow the instructions in the UI.
- Install the pre-built Dojo dashboard on the Dojo instant observability page
What's next?
With the browser agent installed and instrumented with your app, you can then view your raw data in Metrics & events. The default transform the raw data into charts and graphs that provide a high level view of your system's health. To install our default dashboards, go to our instant observability page