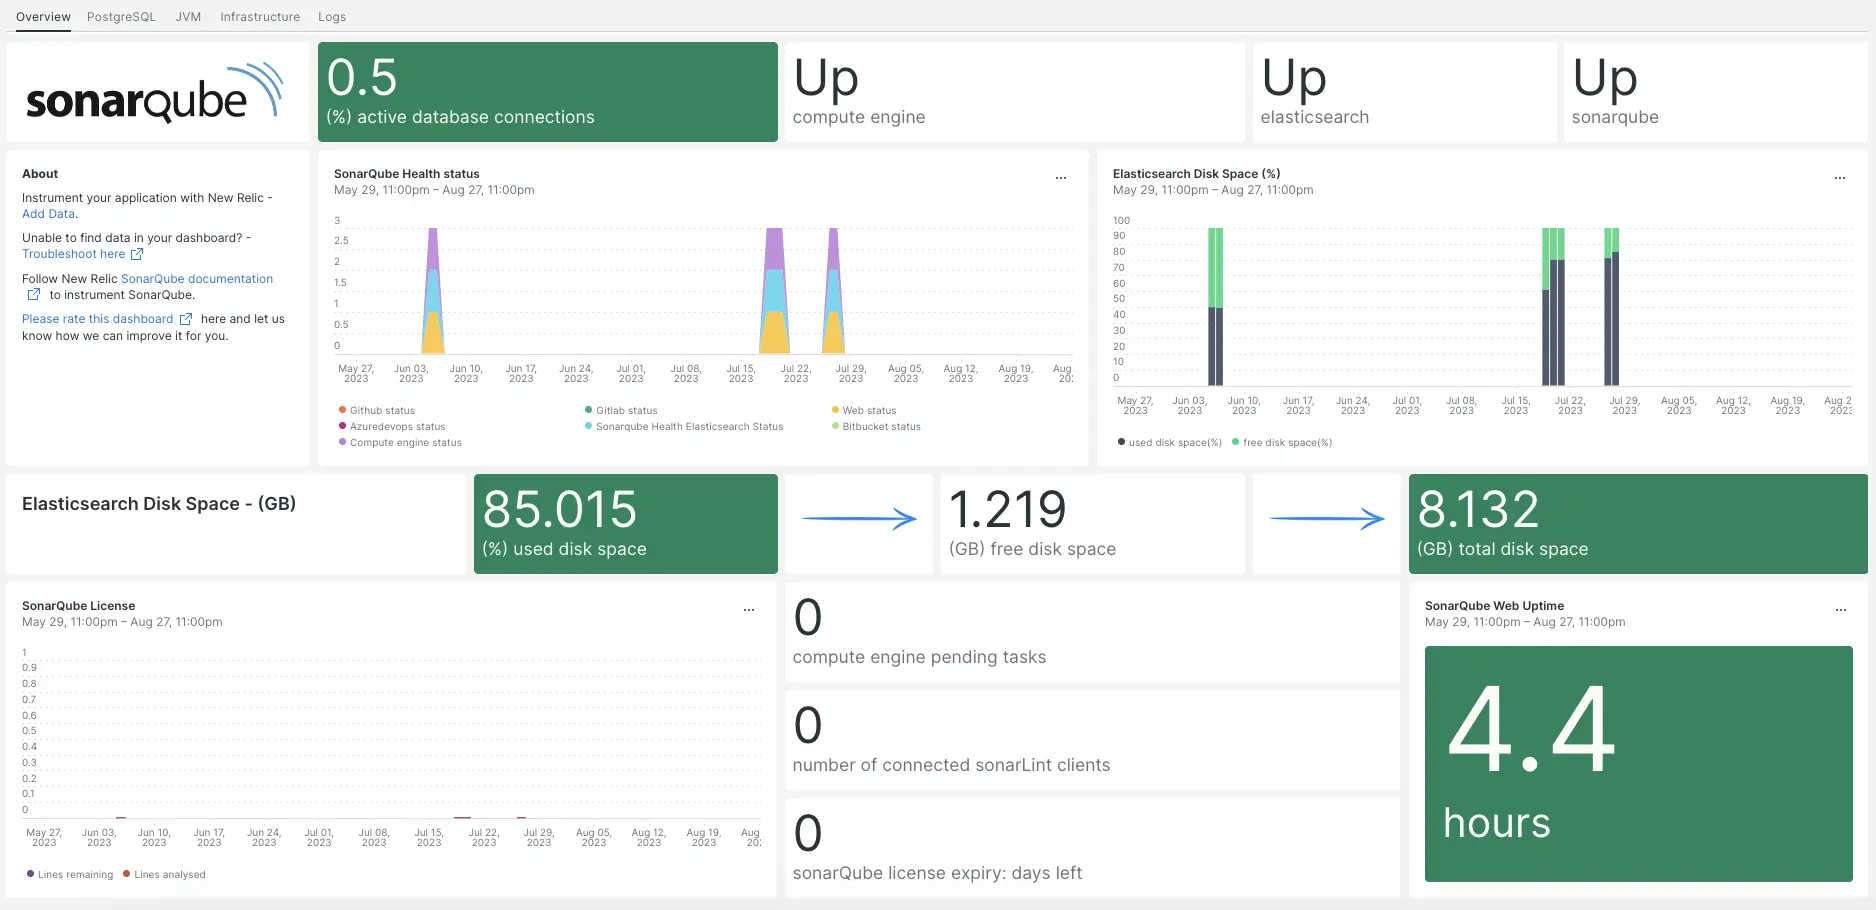
Our SonarQube integration monitors the performance of your SonarQube application, helping you diagnose and optimize the code. Our SonarQube integration makes use of our infrastructure agent, PosgreSQL integration, NRI-Prometheus, and NRI-JMX and gives you a pre-built dashboard with your most important SonarQube metrics.

After setting up our SonarQube integration, we give you a dashboard for your SonarQube metrics.
Install the infrastructure agent
To use the SonarQube integration, you need to first install the infrastructure agent on the same host. All our on-host integrations require the infrastructure agent, which helps expose and report metrics to New Relic.
Install the PostgreSQL integration
To use the SonarQube integration, you need to first install our PostgreSQL integration.
- Check out our PostgreSQL integration requirements in our documentation before installing the integration. Confirm your compatibility, then return to this doc.
- Open PostgreSQL Quickstart page PostgreSQL quickstart installation.
- Click Install now to start the PostgreSQL quickstart installation.
Configure NRI-Prometheus
Run the following command to create a NRI-Prometheus config file:
bash$touch /etc/newrelic-infra/integrations.d/nri-prometheus-config.ymlPaste the following snippet into the new config file. Be sure to update the
cluster_nameandurlswith your relevant fields:integrations:- name: nri-prometheusconfig:# When standalone is set to false nri-prometheus requires an infrastructure agent to work and send data. Defaults to truestandalone: false# When running with infrastructure agent emitters will have to include infra-sdkemitters: infra-sdk# The name of your cluster. It's important to match other New Relic products to relate the data.cluster_name: "YOUR_CLUSTER_NAME"targets:- description: Sonarqube metrics listurls: ["http://user_name:password@YOUR_HOST_IP:9000/api/monitoring/metrics"]# tls_config:# ca_file_path: "/etc/etcd/etcd-client-ca.crt"# cert_file_path: "/etc/etcd/etcd-client.crt"# key_file_path: "/etc/etcd/etcd-client.key"# Whether the integration should run in verbose mode or not. Defaults to falseverbose: false# Whether the integration should run in audit mode or not. Defaults to false.# Audit mode logs the uncompressed data sent to New Relic. Use this to log all data sent.# It does not include verbose mode. This can lead to a high log volume, use with careaudit: false# The HTTP client timeout when fetching data from endpoints. Defaults to 30s.# scrape_timeout: "30s"# Length in time to distribute the scraping from the endpointsscrape_duration: "5s"# Number of worker threads used for scraping targets.# For large clusters with many (>400) endpoints, slowly increase until scrape# time falls between the desired `scrape_duration`.# Increasing this value too much will result in huge memory consumption if too# many metrics are being scraped.# Default: 4# worker_threads: 4# Whether the integration should skip TLS verification or not. Defaults to falseinsecure_skip_verify: truetimeout: 10s
Install and configure the JMX integration
To use the SonarQube integration, you need to also install our JMX monitoring integration. The JMX integration scrapes SonarQube data, which we will later turn into dashboards and queryable data.
Add the following code snippet to
/opt/sonarqube/conf/sonar.properties:# SonarQube Web Server JMX configuration.sonar.web.javaOpts=-Dcom.sun.management.jmxremote \-Dcom.sun.management.jmxremote.port=9010 \-Dcom.sun.management.jmxremote.authenticate=false \-Dcom.sun.management.jmxremote.ssl=false# SonarQube Compute Engine JMX configuration.sonar.ce.javaOpts=-Dcom.sun.management.jmxremote \-Dcom.sun.management.jmxremote.port=9011 \-Dcom.sun.management.jmxremote.authenticate=false \-Dcom.sun.management.jmxremote.ssl=falseAdd the following code snippet to
/etc/newrelic-infra/integrations.d/jvm-sonarqube-web-metrics.yml/:collect:- domain: SonarQubeevent_type: JVMSampleSonarQubeWebMetricsbeans:- query: name=AsyncExecutionattributes:- QueueSize- WorkerCount- LargestWorkerCount- query: name=Databaseattributes:- MigrationStatus- PoolActiveConnections- PoolMaxActiveConnections- PoolIdleConnections- PoolMaxIdleConnections- PoolMinIdleConnections- PoolInitialSize- PoolMaxWaitMillis- PoolRemoveAbandoned- PoolRemoveAbandonedTimeoutSeconds- query: name=SonarQubeattributes:- Version- ServerId- LogLevelAdd the following code snippet to
/etc/newrelic-infra/integrations.d/jvm-sonarqube-compute-engine-metrics.yml:collect:- domain: SonarQubeevent_type: JVMSampleSonarQubeComputeEngineMetricsbeans:- query: name=ComputeEngineDatabaseConnectionattributes:- PoolInitialSize- PoolActiveConnections- PoolMaxActiveConnections- PoolIdleConnections- PoolMaxIdleConnections- PoolMinIdleConnections- PoolMaxWaitMillis- PoolRemoveAbandoned- PoolRemoveAbandonedTimeoutSeconds- query: name=ComputeEngineTasksattributes:- PendingCount- LongestTimePending- InProgressCount- ErrorCount- SuccessCount- ProcessingTime- WorkerMaxCount- WorkerCount- WorkerUuids- EnabledWorkerUuidsAdd the following code snippet to
/etc/newrelic-infra/integrations.d/jmx-sonarqube-compute-engine-config.yml:integrations:- name: nri-jmxenv:COLLECTION_FILES: /etc/newrelic-infra/integrations.d/jvm-sonarqube-compute-engine-metrics.ymlJMX_HOST: <YOUR_HOST>JMX_PASS: adminJMX_PORT: 9010JMX_USER: adminCONNECTION_URL: service:jmx:rmi://<YOUR_IP>:9010/jndi/rmi://<YOUR_IP>:9010/jmxrmiREMOTE_MONITORING: "true"interval: 15slabels:env: stagingAdd the following code snippet to
/etc/newrelic-infra/integrations.d/jmx-sonarqube-web-config.yml:integrations:- name: nri-jmxenv:COLLECTION_FILES: /etc/newrelic-infra/integrations.d/jvm-sonarqube-web-metrics.ymlJMX_HOST: <YOUR_HOST>JMX_PASS: adminJMX_PORT: 9011JMX_USER: adminCONNECTION_URL: service:jmx:rmi://<YOUR_IP>:9011/jndi/rmi://<YOUR_IP>:9011/jmxrmiREMOTE_MONITORING: "true"interval: 15slabels:env: staging
Forward SonarQube logs to New Relic
Follow these steps to forward SonarQube logs to New Relic:
Create a log file named
logging.ymlin the following path:bash$cd /etc/newrelic-infra/logging.dAdd the following script to the
logging.ymlfile:logs:- name: sonar_logsfile: /opt/sonarqube/logs/sonar.logattributes:logtype: sonar_logs- name: ce_logsfile: /opt/sonarqube/logs/ce.logattributes:logtype: sonar_ce_logs- name: es_logsfile: /opt/sonarqube/logs/es.logattributes:logtype: sonar_es_logs- name: web_logsfile: /opt/sonarqube/logs/web.logattributes:logtype: sonar_web_logs
Restart the New Relic infrastructure agent
Restart your infrastructure agent:
$sudo systemctl restart newrelic-infra.serviceIn a couple of minutes, your application will send metrics to one.newrelic.com.
Find your data
You can choose our pre-built dashboard template named SonarQube to monitor your SonarQube application metrics. Follow these steps to use our pre-built dashboard template:
From one.newrelic.com, go to the + Integrations & Agents page.
Click on Dashboards.
In the search bar, type
sonarqube.The SonarQube dashboard should appear. Click on it to install it.
Your SonarQube dashboard is considered a custom dashboard and can be found in the Dashboards UI. For docs on using and editing dashboards, see our dashboard docs.
Here's a few example NRQL queries for Postfix data:
What's next?
To learn more about building NRQL queries and generating dashboards, check out these docs:
- Introduction to the query builder to create basic and advanced queries.
- Introduction to dashboards to customize your dashboard and carry out different actions.
- Manage your dashboard to adjust your dashboards display mode, or to add more content to your dashboard.