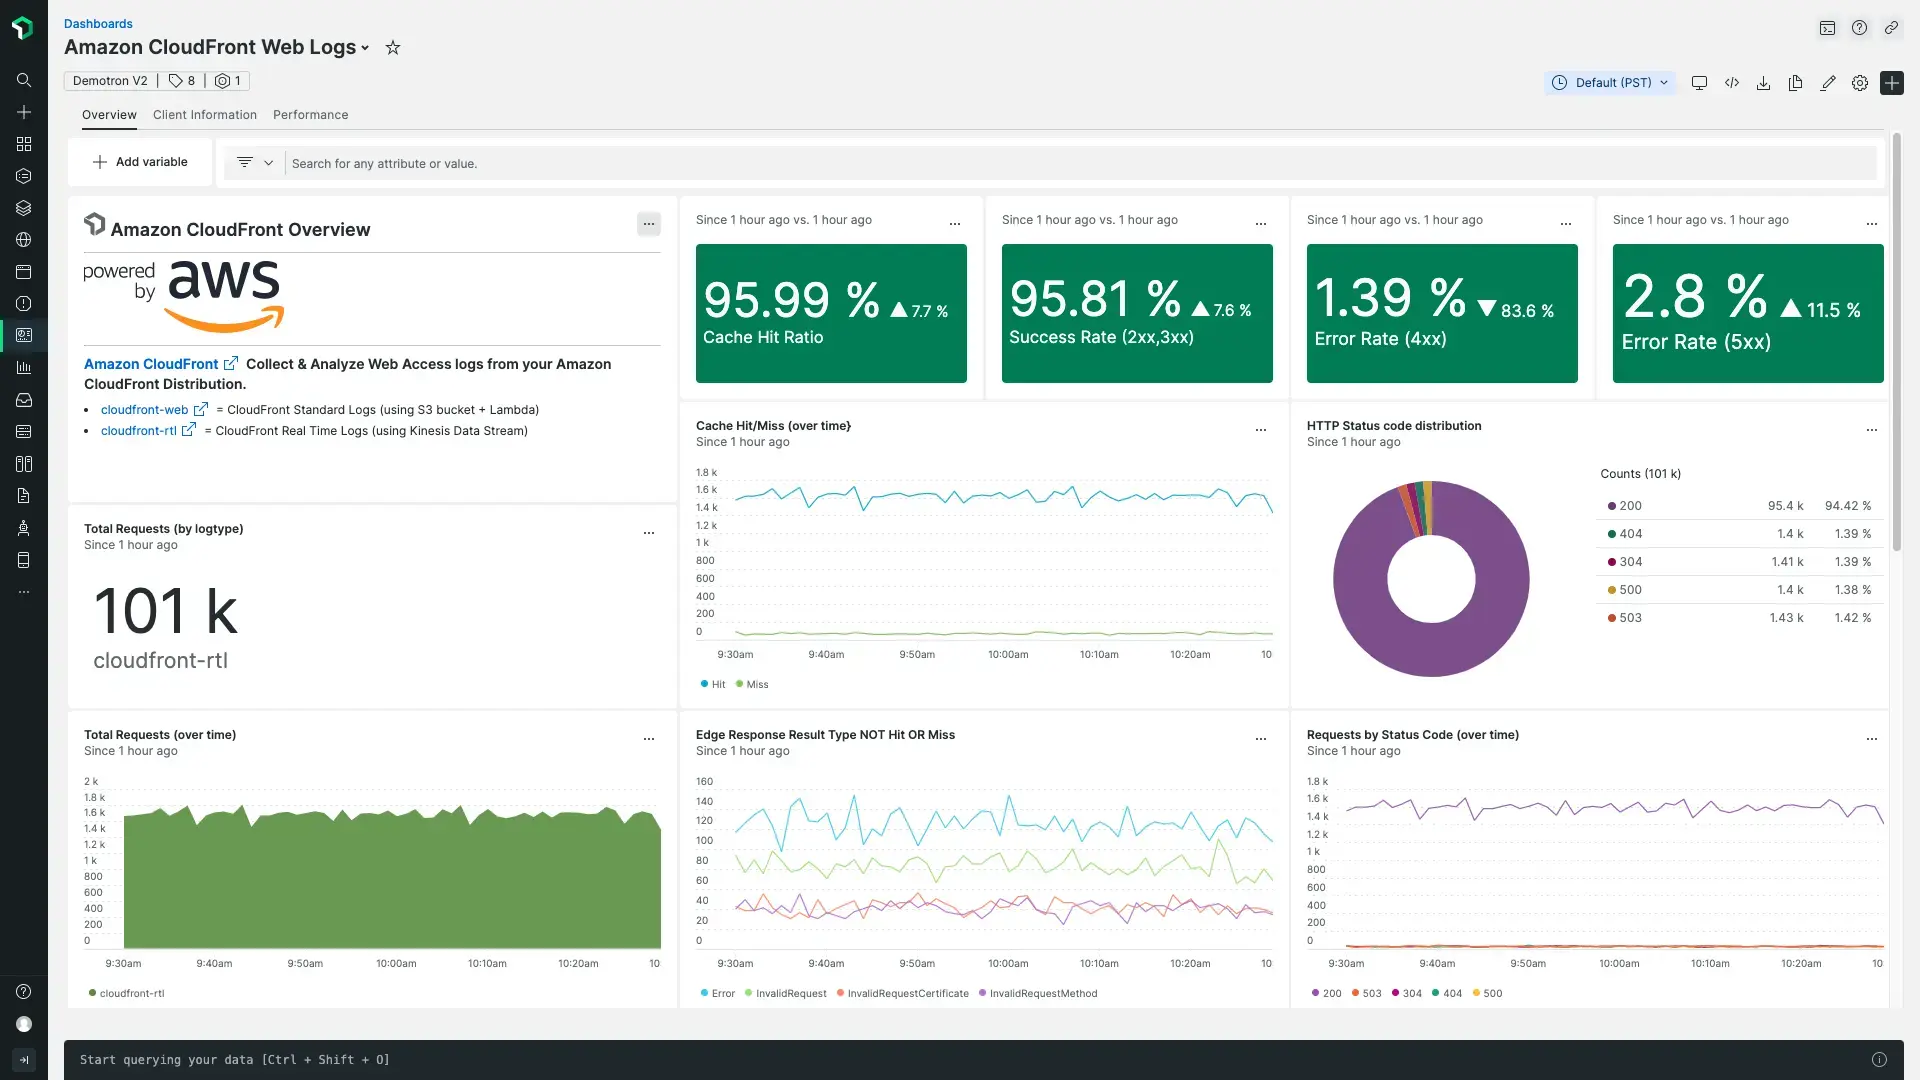
You can enable logging from your Amazon CloudFront distribution to send web access logs to New Relic.
Options for sending logs
There are two options for sending logs from CloudFront: standard logging or real-time logs.
Standard logs are sent from CloudFront to a S3 bucket where they are stored. You would then use our AWS Lambda trigger to send the logs from S3 to New Relic. Review the Amazon CloudFront docs for configuring and using standard logs (access logs). This has detailed information about creating your S3 bucket and setting appropriate permissions. Standard logs include all data fields and are sent to S3 and then to New Relic every 5 minutes. For detailed instructions on how to configure standard logs in the Amazon console and send them to New Relic via our S3 Lambda trigger, see the Enable standard logging section.
Real-time logs are sent within seconds of receiving requests using a Kinesis Data Stream consumer and a Kinesis Data Firehose for delivery to New Relic. Review the Amazon CloudFront docs for configuring real-time logs. Real-time logs are configurable and allow you to configure a sampling rate (what percentage of logs to send), select specific fields to receive in the log records, and define specific cache behaviors (path patterns) that you want to receive logs for. Real-time logs also require an S3 backup bucket for sending either all data, or failed data only. So to enable real-time logs you must also follow our instructions for creating an S3 bucket. For detailed instructions on how to configre standard logs in the Amazaon console and send them to New Relic via our S3 Lambda trigger, see the section Enable real-time logs section.
For both options you can use our built-in log parsing rules to automatically parse your CloudFront access logs, and our quickstart dashboard to immediately gain insight into your data. For the built-in parsing rules to work and to populate data in the widgets of the quickstart dashboard provided, you must configure the logtype attribute as defined in the instructions. For additional details on parsing real-time logs if you only select some of the logging fields, see the Parsing section
Create S3 bucket for storing CloudFront logs
To enable standard logs or real-time logs for your CloudFront distribution, you must first create an S3 bucket to use for storing CloudFront access logs in:
- In the AWS Management Console, choose Services > All services > S3.
- Select Create bucket.
- Enter a Bucket name and select the AWS region of your choice. (Note that your S3 bucket must be in the same region as your Lambda function you create in the next section if you are using Standard logging.)
- In the Object ownership section, select ACLs enabled.
- Select Create bucket.
Now you can enable either standard or real-time logging. For instructions for those options, keep reading.
Enable standard logging
Update your CloudFront distribution to enable standard logs:
- In the AWS Management Console, choose Services > All Services > CloudFront.
- Click on your distribution ID. On the General tab, select Edit in the Setting section.
- In the Standard logging section, select On to enable logging and display the logging configuration settings.
- For S3 bucket, search for and choose the S3 bucket name you created above.
- Optional: You can add a log prefix like
cloudfront_logs. - Choose Save changes.
Within five minutes, you should begin to see log files appearing in your S3 bucket with the following file name format:
<optional prefix>/<distribution ID>.YYYY-MM-DD-HH.unique-ID.gzNext, you must install and configure our AWS Lambda function NewRelic-log-ingestion-s3 to send the access logs in S3 to New Relic. You'll need a single Lambda function for the Amazon CloudFront logs so you can set the appropriate LOG_TYPE environment variable: this allows you to use our CloudFront built-in parsing rules and the quickstart dashboard. If you already have this Lambda function installed in a region and are using it to send other S3 logs to New Relic (for example ALB/NLB logs), you'll need to install the Lambda function again in another region. Also, as noted earlier your S3 bucket for storing access logs and your Lambda function for sending S3 logs to New Relic must be in the same region.
To do these steps:
- Follow the instructions here to Configure AWS Lambda for sending logs from S3.
- After the Lambda function is installed, select Functions > NewRelic-s3-log-ingestion.
- Select the + Add trigger button under S3.
- For Trigger Configuration, select S3.
- For Bucket, search for and choose the S3 bucket you created above.
- In the Recursive invocation section, check the ackknowledgement box and then choose Add.
- On the Configuration tab for the function, choose the Environment variables option on the left.
- Select Edit, and for the
LOG_TYPEentercloudfront-web. - Select Save.
Within five minutes you should begin to see your logs in the logs UI. To confirm you're receiving logs, you can search for logtype:cloudfront-web in the logs UI search bar, or run a NRQL query with something like FROM Log SELECT * WHERE logtype='cloudfront-web'
Enable real-time logs
To enable real-time logging for your CloudFront distribution, you must first create a Kinesis Data Stream for receiving the CloudFront logs:
- In the AWS Management Console, choose Services > Kinesis.
- Select Data streams, and then Create data stream.
- Enter a Data stream name. For example,
CloudFront-DataStream. - Select a Data Stream capacity mode of your choice.
- Select Create data stream.
- In the Consumers section, select Process with delivery stream.
- For the Destination, select New Relic.
- Enter a Delivery stream name. For example,
CloudFront-DeliveryStream. - In the Destination settings section, for the HTTP endpoint URL, select New Relic logs - US or New Relic logs - EU.
- For API key, enter the for your New Relic account.
- Select Add parameter.
- If you will select all fields for logging in step 21 below, for Key, enter
logtypeand for the Value entercloudfront-rtl. If you plan to select a subset of fields for logging in Step 21 below, entercloudfront-rtl-custom. If you don't choose to select all the fields, see the Real-time logs parsing section below for information on how to create a custom parsing rule for your logs. - In the Backup settings section, you may choose either Failed data only or All data for the Source record backup in Amazon S3 option, based on your preference.
- For the S3 backup bucket, select Browse to search for and select the S3 bucket name you created above for storing CloudFront logs.
- Choose Create delivery stream.
Next, create a real-time logging configuration and attach it to your CloudFront distribution:
- In the AWS Management Console, choose Services > CloudFront.
- In the Telemetry section on the left, select Logs.
- Click on the Real-time configurations tab, and then choose Create configuration.
- Enter a configuration name. For example:
CloudFront-RealTimeLogs. - Enter a sampling rate from
1to100. - For Fields, select All fields or choose the fields you wish to include in your logs.
- For Endpoint, select the Data Stream name you created in Step 3. For example:
CloudFront-DataStream. - In the Distrubutions section, select your CloudFront distribution ID.
- For Cache behaviors, check Default (*).
- Choose Create configuration.
Within a couple minutes you should begin to see your logs in our logs UI. To confirm you're receiving real-time logs, you can search for logtype:cloudfront-rtl* in the logs UI search bar, or via a NRQL query like FROM Log SELECT * WHERE logtype LIKE 'cloudfront-rtl%'
Real-time logs parsing
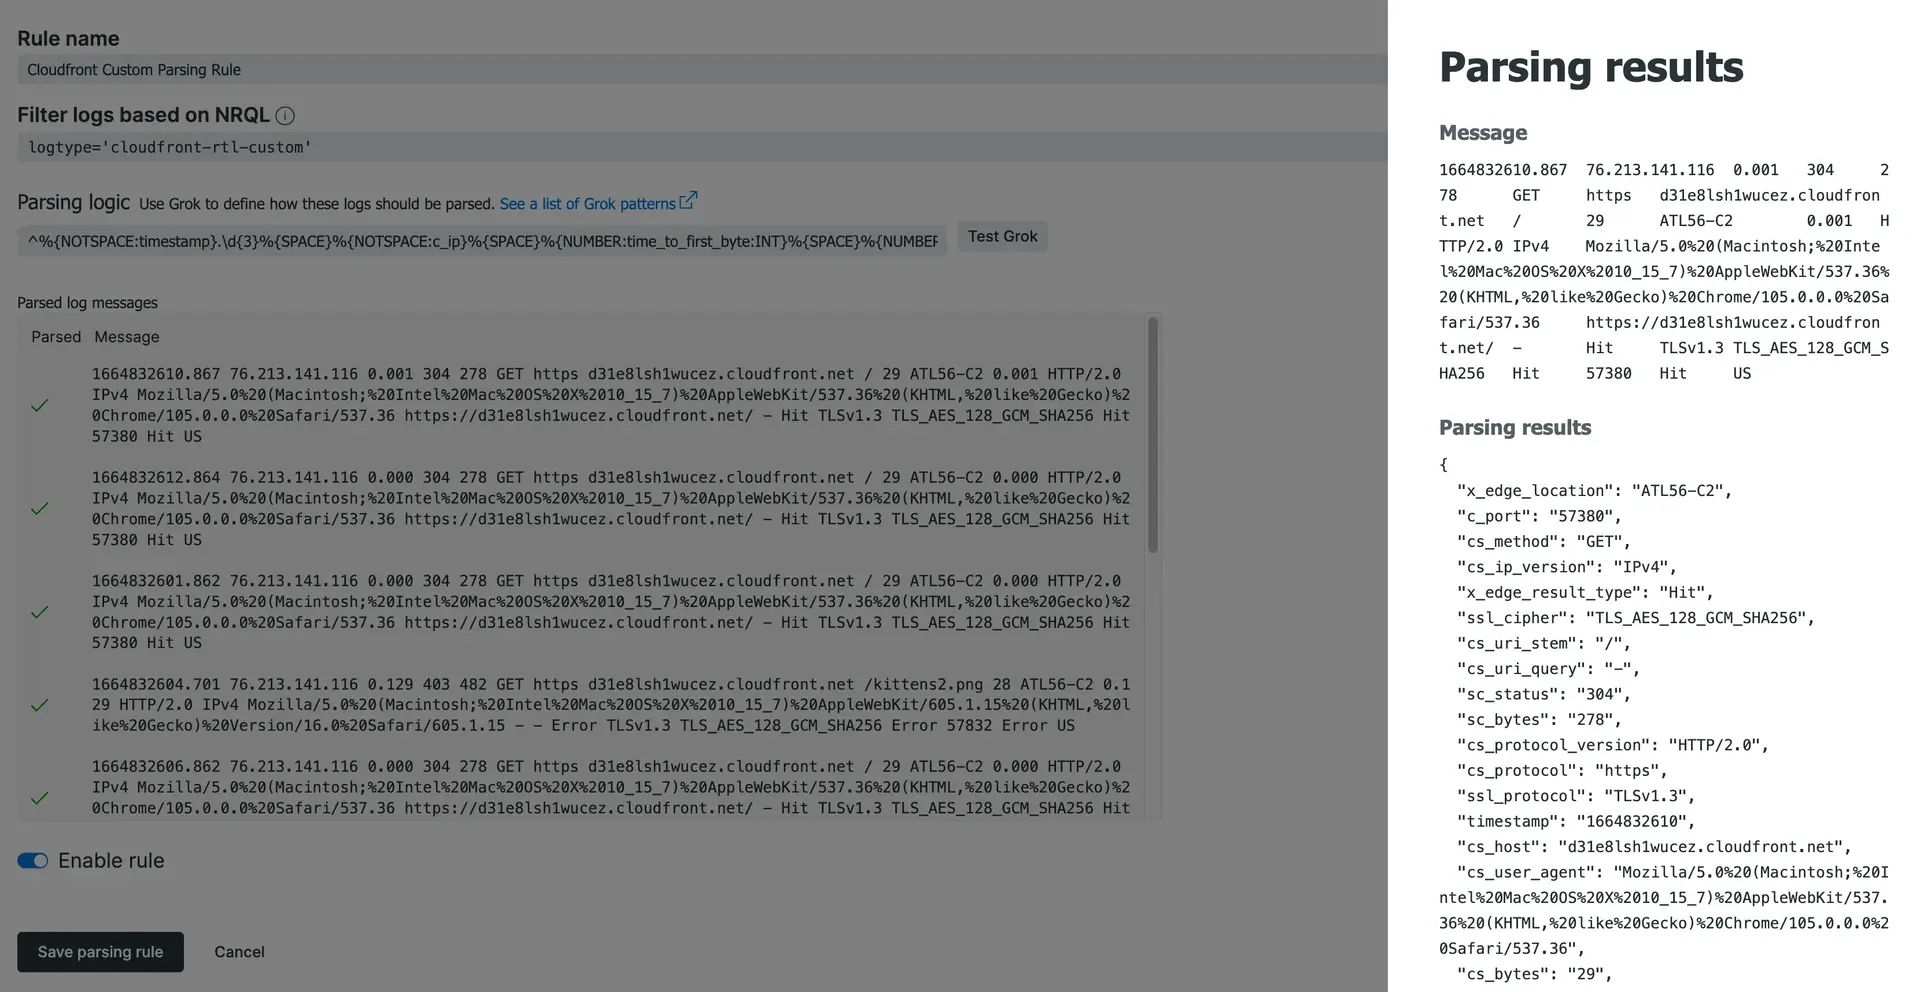
Our built-in parsing rule for real-time logs assumes that all fields will be logged. If you choose to only log a subset of the fields, you must define a custom parsing rule that matches your log format. This is required for the logs to parse correctly and to use our quickstart dashboard.
To create a custom parsing rule, select Parsing in the Manage data section of the logs UI.
- For the Rule name, enter
CloudFront custom parsing rule. - For Filter logs based on NRQL, enter
logtype='cloundfront-rtl-custom'. - Update the Grok parsing logic below so that it includes only the fields you've selected in the real-time logs configuration. For example, if you choose not to include the
cs_headersfield, remove%{SPACE}%{NOTSPACE:cs_headers}%from the Grok, and so on.^%{NOTSPACE:timestamp}.\d{3}%{SPACE}%{NOTSPACE:c_ip}%{SPACE}%{NUMBER:time_to_first_byte:INT}%{SPACE}%{NUMBER:sc_status:INT}%{SPACE}%{NUMBER:sc_bytes:INT}%{SPACE}%{WORD:cs_method}%{SPACE}%{NOTSPACE:cs_protocol}%{SPACE}%{NOTSPACE:cs_host}%{SPACE}%{NOTSPACE:cs_uri_stem}%{SPACE}%{NUMBER:cs_bytes:INT}%{SPACE}%{NOTSPACE:x_edge_location}%{SPACE}%{NOTSPACE:x_edge_request_id}%{SPACE}%{NOTSPACE:x_host_header}%{SPACE}%{NUMBER:time_taken:INT}%{SPACE}%{NOTSPACE:cs_protocol_version}%{SPACE}%{NOTSPACE:cs_ip_version}%{SPACE}%{NOTSPACE:cs_user_agent}%{SPACE}%{NOTSPACE:cs_referer}%{SPACE}%{NOTSPACE:cs_cookie}%{SPACE}%{NOTSPACE:cs_uri_query}%{SPACE}%{NOTSPACE:x_edge_response_result_type}%{SPACE}%{NOTSPACE:x_forwarded_for}%{SPACE}%{NOTSPACE:ssl_protocol}%{SPACE}%{NOTSPACE:ssl_cipher}%{SPACE}%{NOTSPACE:x_edge_result_type}%{SPACE}%{NOTSPACE:fle_encrypted_fields}%{SPACE}%{NOTSPACE:fle_status}%{SPACE}%{NOTSPACE:sc_content_type}%{SPACE}%{NOTSPACE:sc_content_len}%{SPACE}%{NOTSPACE:sc_range_start}%{SPACE}%{NOTSPACE:sc_range_end}%{SPACE}%{NUMBER:c_port:INT}%{SPACE}%{NOTSPACE:x_edge_detailed_result_type}%{SPACE}%{NOTSPACE:c_country}%{SPACE}%{NOTSPACE:cs_accept_encoding}%{SPACE}%{NOTSPACE:cs_accept}%{SPACE}%{NOTSPACE:cache_behavior_path_pattern}%{SPACE}%{NOTSPACE:cs_headers}%{SPACE}%{NOTSPACE:cs_header_names}%{SPACE}%{NOTSPACE:cs_headers_count}$ - Paste the updated Grok into the parsing logic section, and then select the Test grok to validate that your parser is working.
- Enable the rule and then choose Save parsing rule.

A screenshot of the CloudFront custom parsing configuration.
What's next?

Our quickstart for Amazon CloudFront Access Logs includes a pre-built dashboard.
Here are some ideas for next steps:
- Get started in minutes with a pre-built dashboard to see key metrics from your Amazon CloudFront access logs. Go to the Amazon CloudFront access logs quickstart and click Install now.
- Explore logging data across your platform with our logs UI.
- Get deeper visibility into both your application and your platform performance data by forwarding your logs with our logs in context capabilities.
- Set up alerts.
- Query your data and create dashboards.
Disable log forwarding
To disable log forwarding capabilities, there are two options. If you just want to stop sending the S3 logs to New Relic you can delete the S3 trigger in the NewRelic-log-ingestion-s3 Lambda function. If you want to disable Amazon CloudFront access logs completely you will need to delete the trigger as well as turn off logging in the general settings of the CloudFront distribution.