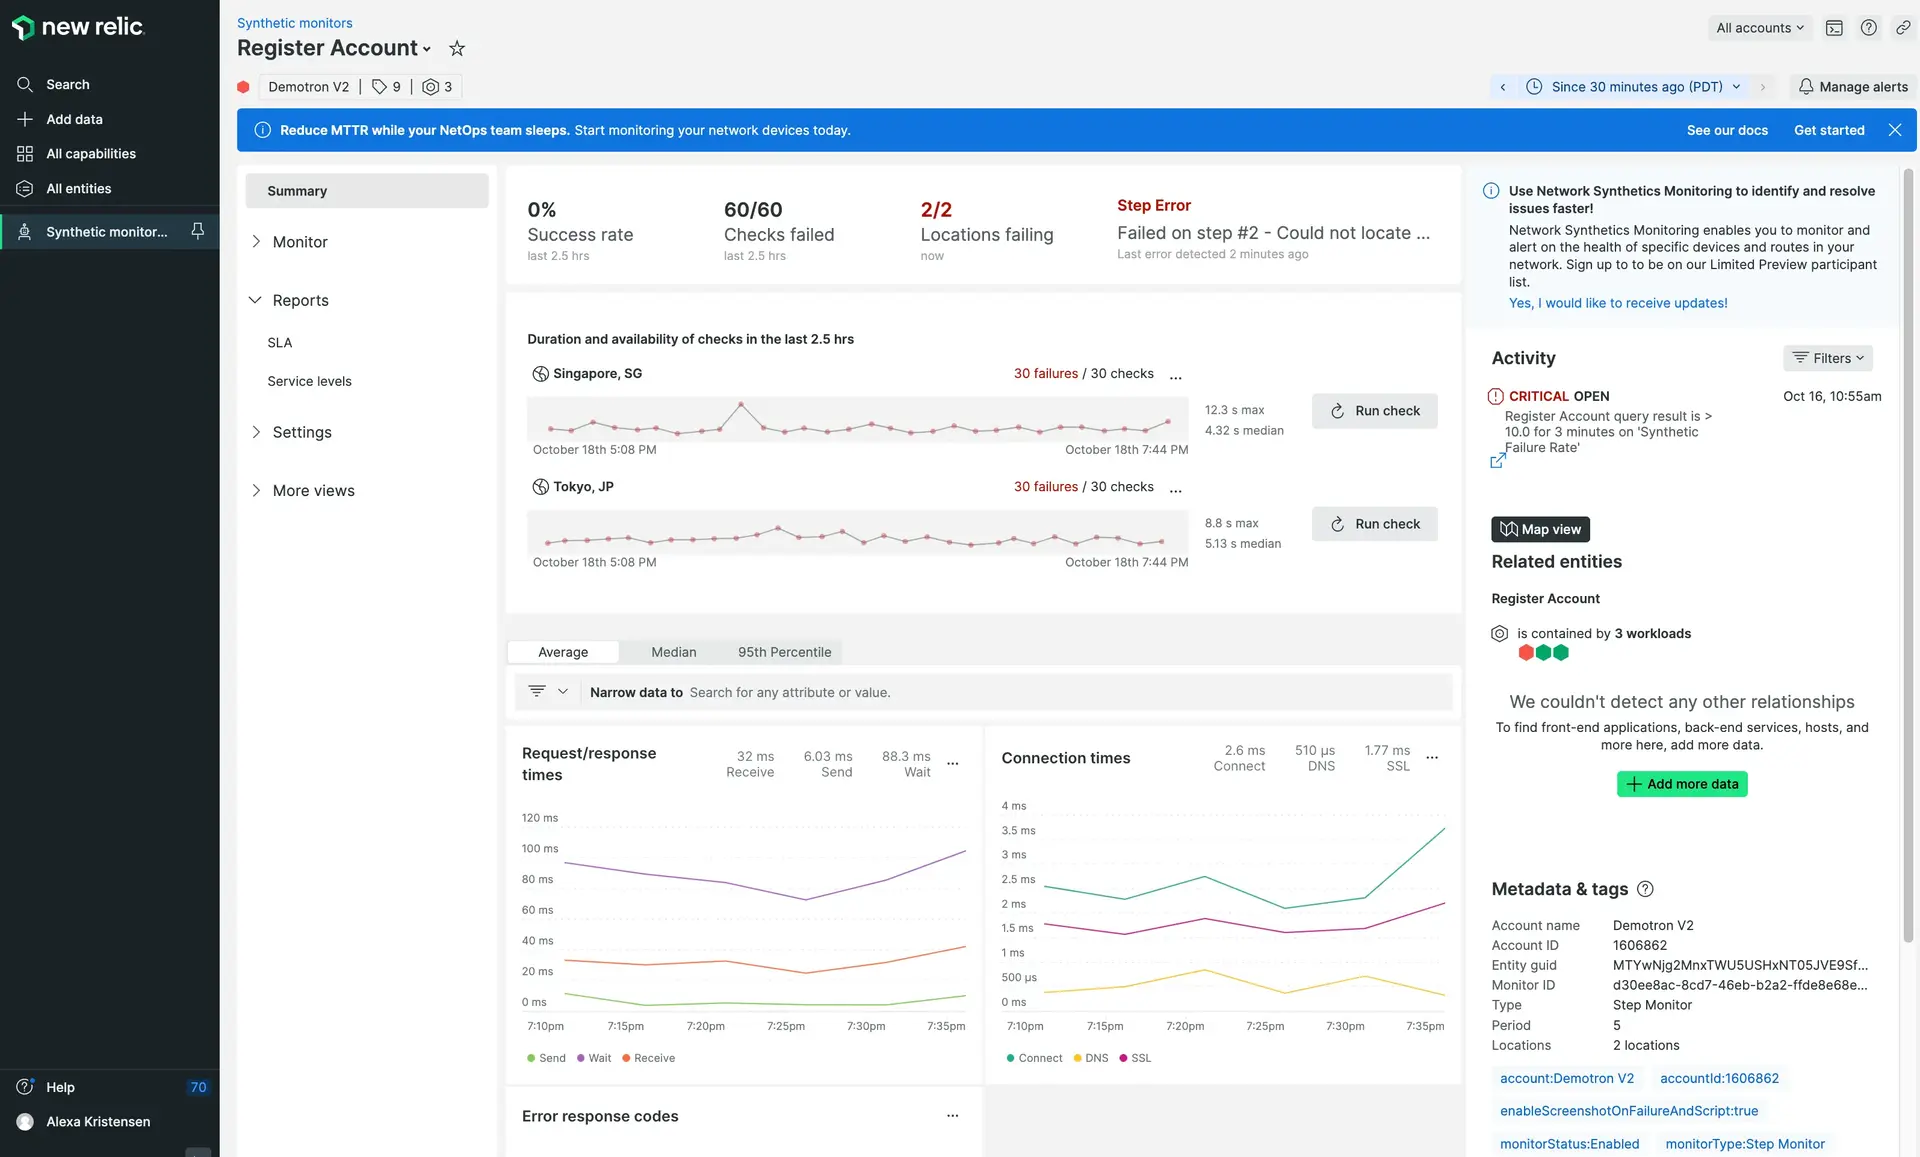
The Summary page of synthetic monitoring gives you an at-a-glance understanding of your website's performance. You can look for trends in request/response times, connection times, and errors. Use the filter to narrow data to attributes or values of interest, or recheck failed monitors.
View the Summary page
To access your monitor's Summary page: Go to one.newrelic.com > Synthetic monitoring > (select a monitor).

The Summary page gives you a high-level view of your website's performance, and has shortcuts to location checks, alert incidents, and your monitor's metadata.
Understand the Summary page
Use the Summary page to understand your website's performance:
Synthetic Summary charts | Description |
|---|---|
Success and failure rate | This shows the monitor's overall success rate and total number of check failed during the given timeframe, the number of locations that are failing, and the error message for the last error detected. The timeframe displayed will vary depending on the frequency of the monitor:
|
Page load time and availability | This shows the page load times and availability, the percentage of monitor runs that were successful, for each monitor location. The timeframe displayed will vary depending on the frequency of the monitor:
|
Request/response times | This shows the time that it took the ping monitor to send and receive a response, and is broken down into duration sent, duration wait, and duration received. Durations can be displayed as Average, Median, or 95th Percentile. For more information see, Percentiles: Ranking data. This is only available for ping monitor results. |
Connection times | This shows the breakdown for the network connections to be established for this monitor, and is broken down into the DNS, SSL, and connection durations. Duration can be displayed as Average, Median, or 95th Percentile. For more information see, Percentiles: Ranking data. This is only available for ping monitor results. |
Non-200 response codes | This shows any (non-200) error response code that were received as a result of running this monitor. This is only available for ping monitor results. |
Activity panel | Displays any recent activity associated with the monitor, including:
|
Use page functions
The Summary page supports the following functions:
If you want to... | Do this... |
|---|---|
View a result in detail | To view exact metrics, hover the mouse over the chart. |
Re-run a monitor check | Click the Run check button to recheck any failed monitor. |
View detailed about an alert incident | In the Activity panel, click on the displayed alert to go directly to the alert incident page. |
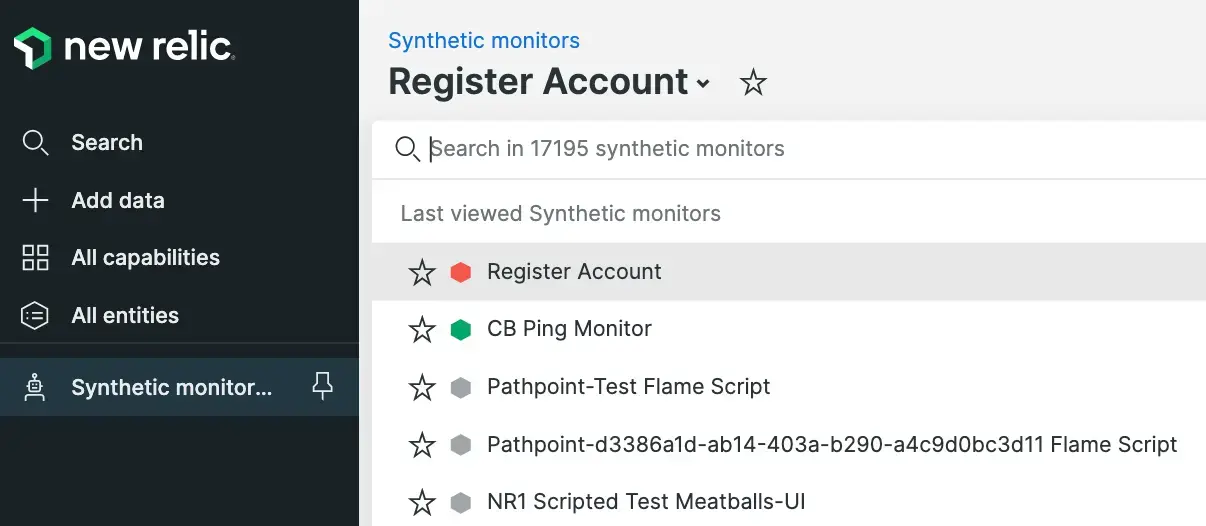
Quickly access another monitor | |
Change the time frame | Use the time picker to adjust the number of results returned for the following charts:
|
Legacy charts
Importante
The following table applies to the old view of the synthetic monitoring summary page. Click Show new view to access a new curated summary experience.
Synthetic chart | Description |
|---|---|
Load time chart | This shows the load times for each monitor location. When you select a short time frame (such as 30 minutes), synthetic monitoring displays the exact load time for each run of your monitor from each location. With longer time frames, synthetic monitors adjusts the resolution to show averages. To toggle the visibility of a location, select its label. |
Availability | This shows the percentage of monitor runs that were successful. For a scripted monitor, the entire script must complete for the run to be considered a success. Above the selected monitor's Availability chart, an ellipsis icon appears. Use New Relic's comparative charting feature for a direct page load time comparison between real user () interactions and the synthetic monitors. |
Average load size | This chart shows the amount of data (in kilobytes or megabytes) consumed in each run of the monitor. For scripted monitors, the entire script is included in the average load size graph. For example, a monitor that loads three pages will measure the size of all assets on all three pages. If your site is static, the average load size will be very consistent. For dynamic sites such as a news site, the average load size will vary as your page content changes. |
Slowest results | This lists the five slowest results for the selected time frame. To view the performance breakdown, select a result. |
Monitor downtimes | This lists the most recent monitor downtime incidents. To view additional details, select a downtime incident. |
