There are three ways to create an alert condition in New Relic: With a chart, a NRQL query, or with golden metrics. While the beginning of the creation process is different depending on which option you choose, all the subsequent steps are the same. This means that once you've created a condition one way, the experience you gain from doing so will transfer over to others that you create using either of the other options.
For this tutorial, we've included steps for all three of the aforementioned options, so you can get started with your first condition any way you want to. Just select the path you want to follow in the first step, and by the end of the procedure you'll have successfully made your first alert condition using New Relic!
Dica
If you need more information on any of the options or terms covered in the steps below, check out our alerts docs.
Starting from a chart is one of the easiest ways to set up a New Relic alert condition. Instead of creating a NRQL query from scratch, charts let you use pre-existing NRQL queries to begin the process.
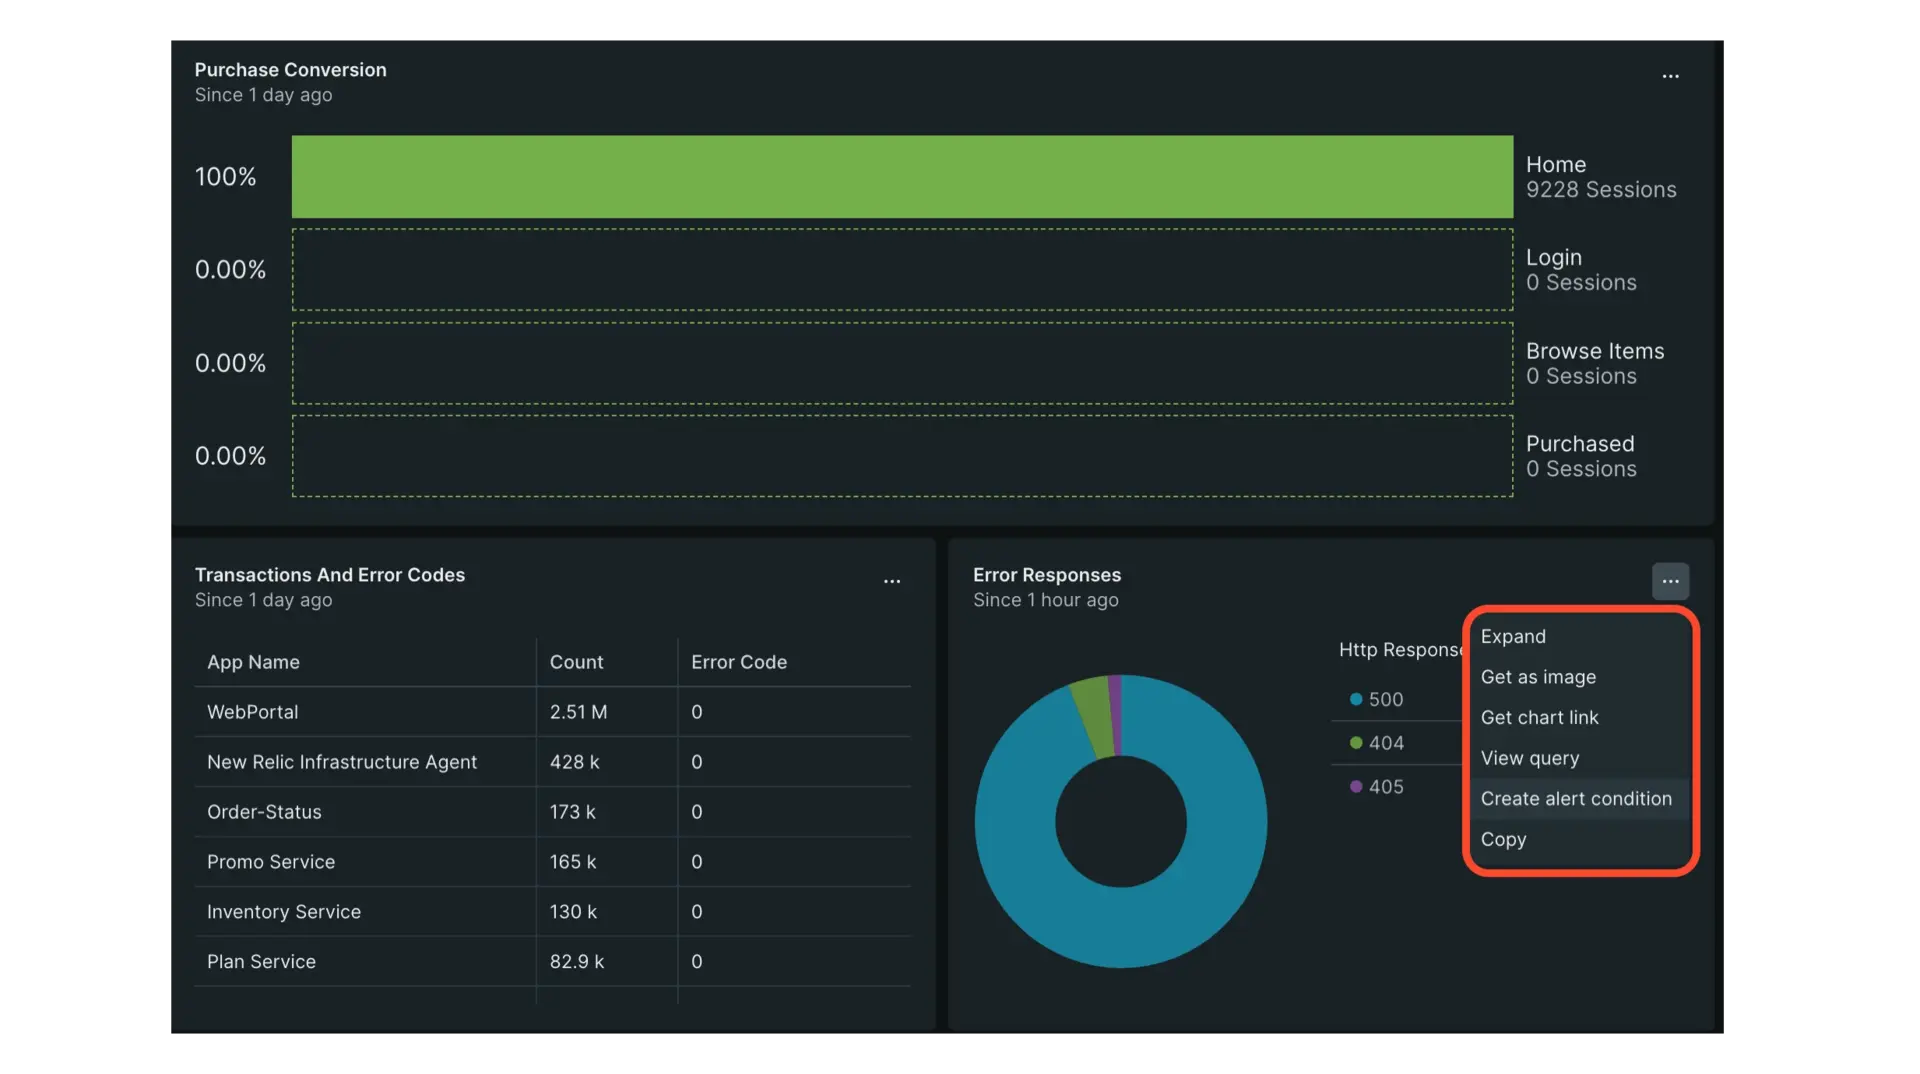
In this example, we'll set up an alert condition using an error response chart. Follow the steps below with any type of chart you like to begin.
Go to any dashboard. Then, find a chart you want to use, click the "..." menu, and select Create alert condition.
Select the signal, or stream of data, you want to use to create the alert condition. To keep things simple, Build a query is the default option for conditions created this way.
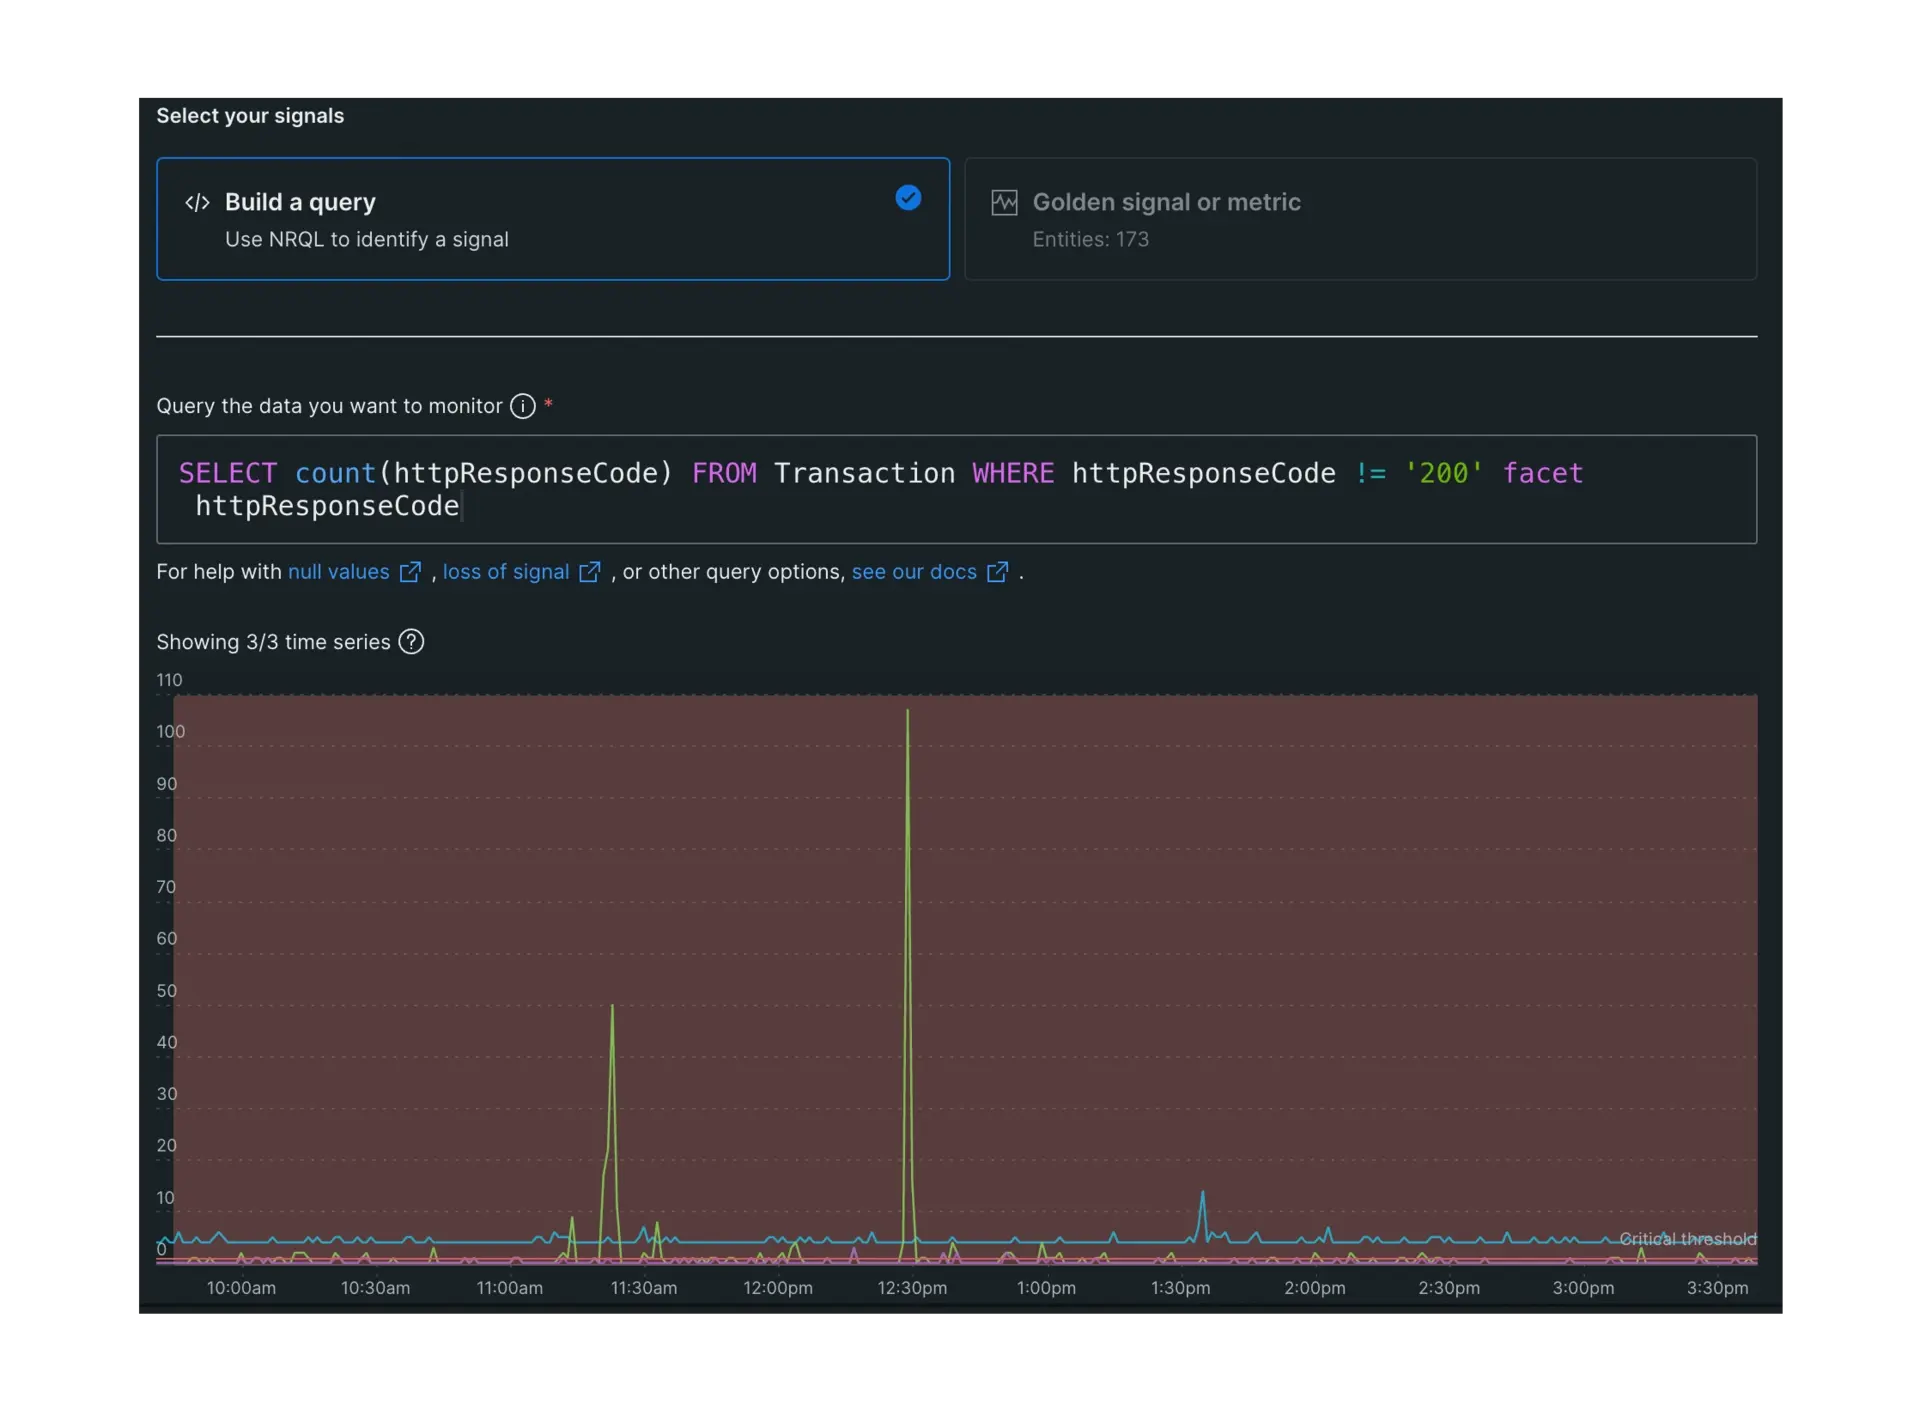
Modify the NRQL query to match what you want you to monitor, if necessary. For now, we recommend leaving the query as is, but once you have a better handle on and NRQL queries, you can change the query to monitor nearly any signal.
Select Next once you've finished to save your progress and move on to the next step.
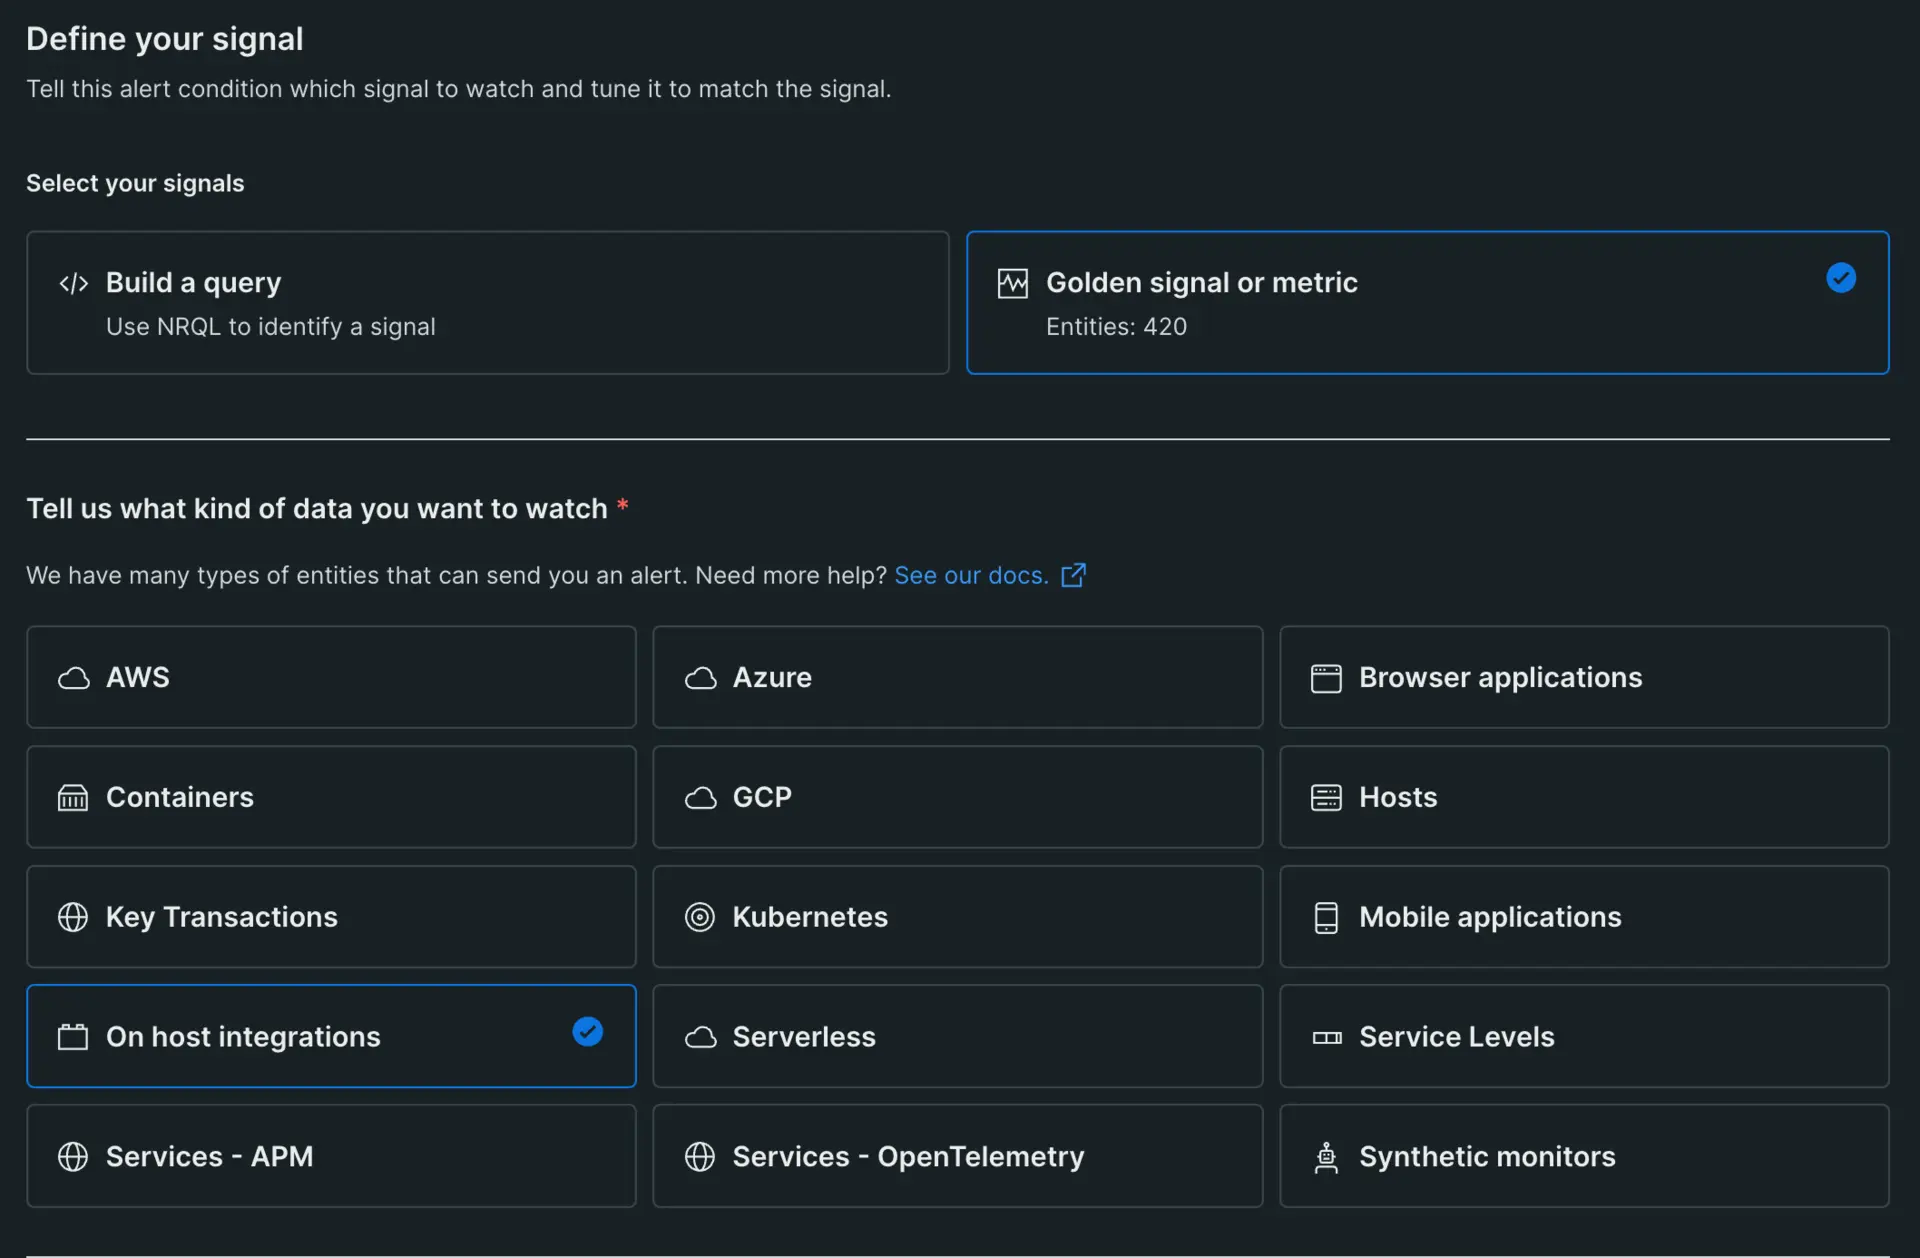
One of the easiest ways to get started is to use our Golden signal or metric option. When selected, this capability gives you a guided creation path for making a condition. All you have to do is select the options you want and let us do the rest!
The following example will use specific options, but you can change whatever you need to create the exact alert condition that fits your specific needs.
From one.newrelic.com, select Alerts , then Alert conditions (policies).
Select New alert condition.
Select Golden signal or metrics.
Choose any of the listed entity categories to determine what the alert condition will monitor. For this example, On host integrations is selected, but you can choose any other option that better suits your needs.
If you are using services like AWS, Kubernetes, on host integrations, and others, you will also need to select an entity type before you can select an individual entity. Select the entity type to narrow down the options for the next step.
Select the entity or entities you want to monitor. If you have many entities to choose from, you can use the filter field to shorten the list and find what you need.
Select the signal you want to monitor. This example uses interaction to next paint (INP) (75 percentile), but you can use any other option that better suits your needs.
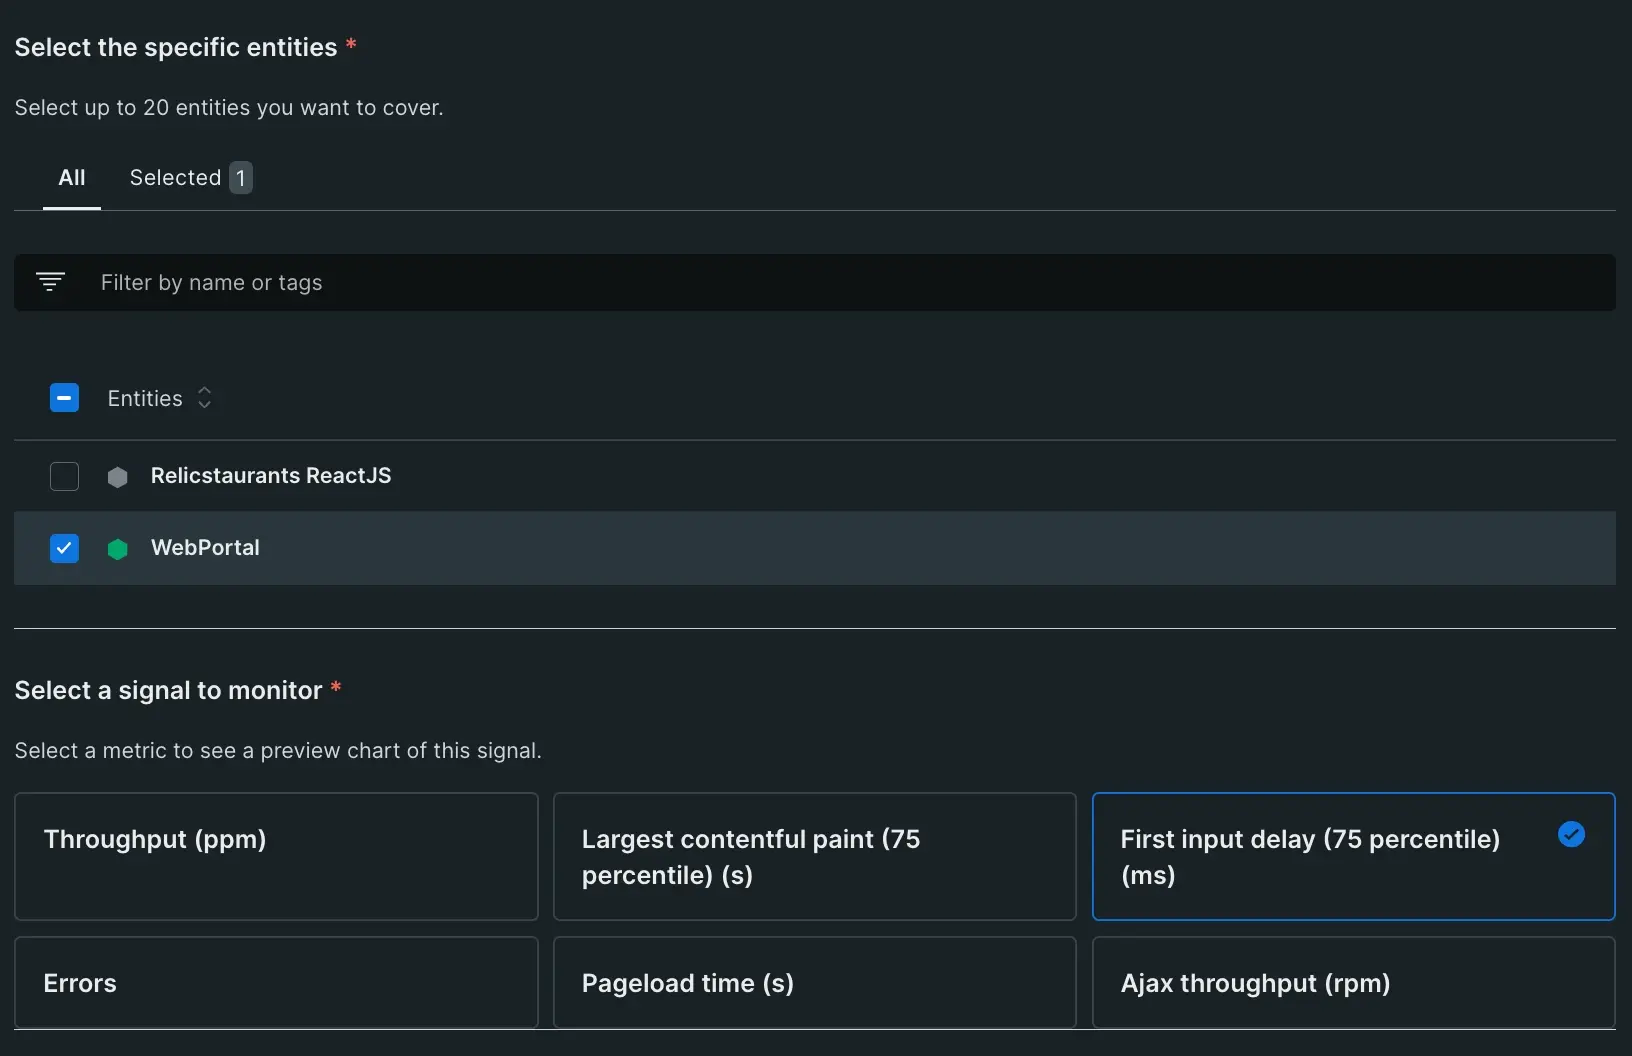
You can choose a curated golden metric, or select from any other metric that has reported in the last 30-minutes.
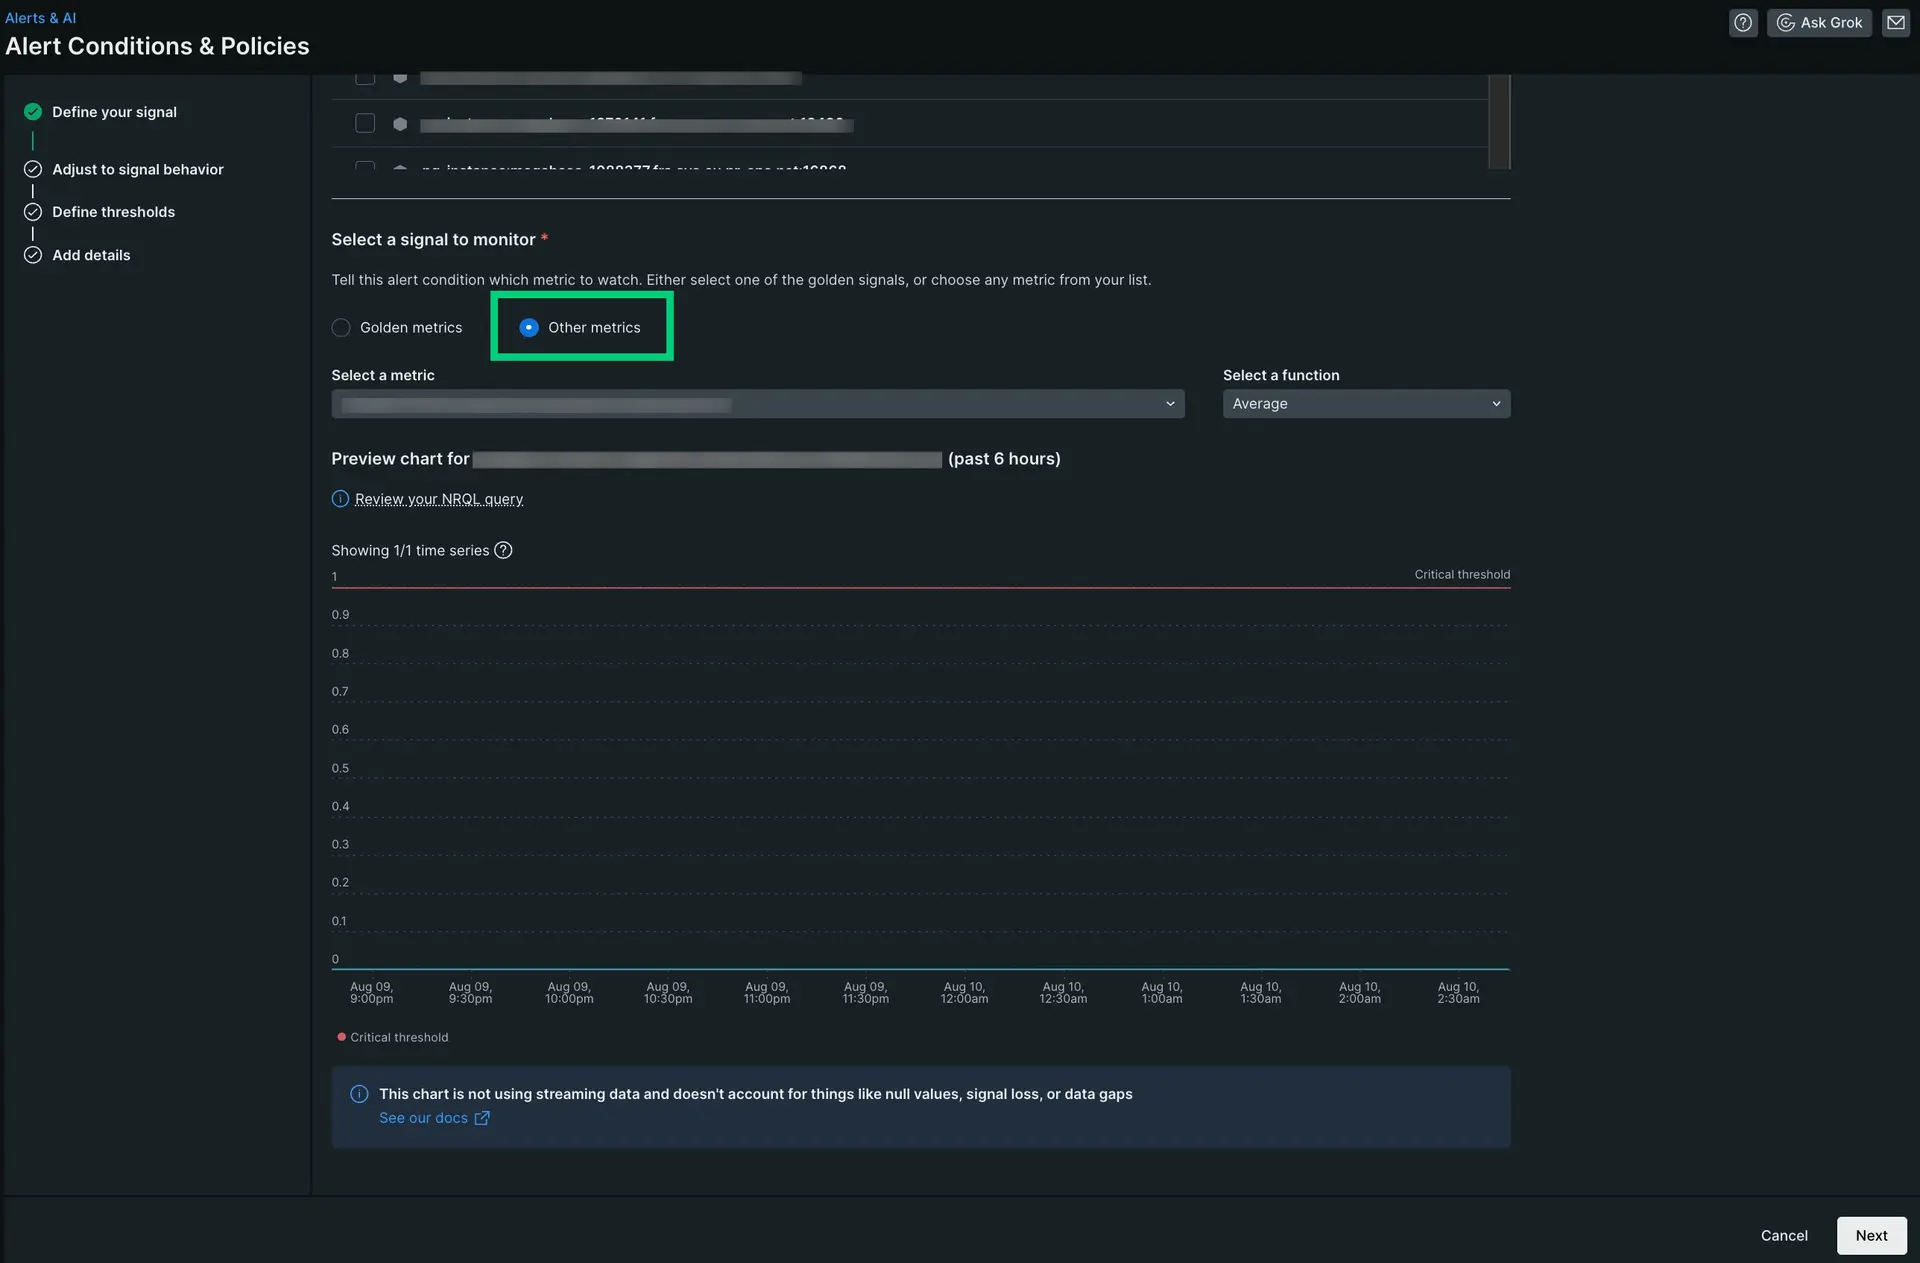
Select Next once you've finished to save your progress and move on to the next step.
Dica
The categories that are available to you are dependent what New Relic monitors in your account.
While using charts is a great way to create alert conditions from premade queries, sometimes you need to create them from scratch. The process for creating a new alert condition from a NRQL query is almost the exact same as creating it from a chart: the key difference is that you write the NRQL query manually instead of using a pre-generated one.
Dica
NRQL stands for New Relic's Query Language—a standardized query method that powers all our charts, and which you can use to analyze and query your data. If this is your first time working with NRQL, you may want to check out our NRQL docs to learn more about NRQL, including how it works and an introductory tutorial.

From one.newrelic.com, select Alerts, then Alert conditions (policies).
Select New alert condition.
Write the NRQL query to create the condition. For example, if you wanted to monitor slow transactions, you can enter:
SELECT average(duration) from Transaction facet nameSelect Next once you've finished to save your progress and move on to the next step.
Adjust the signal behavior
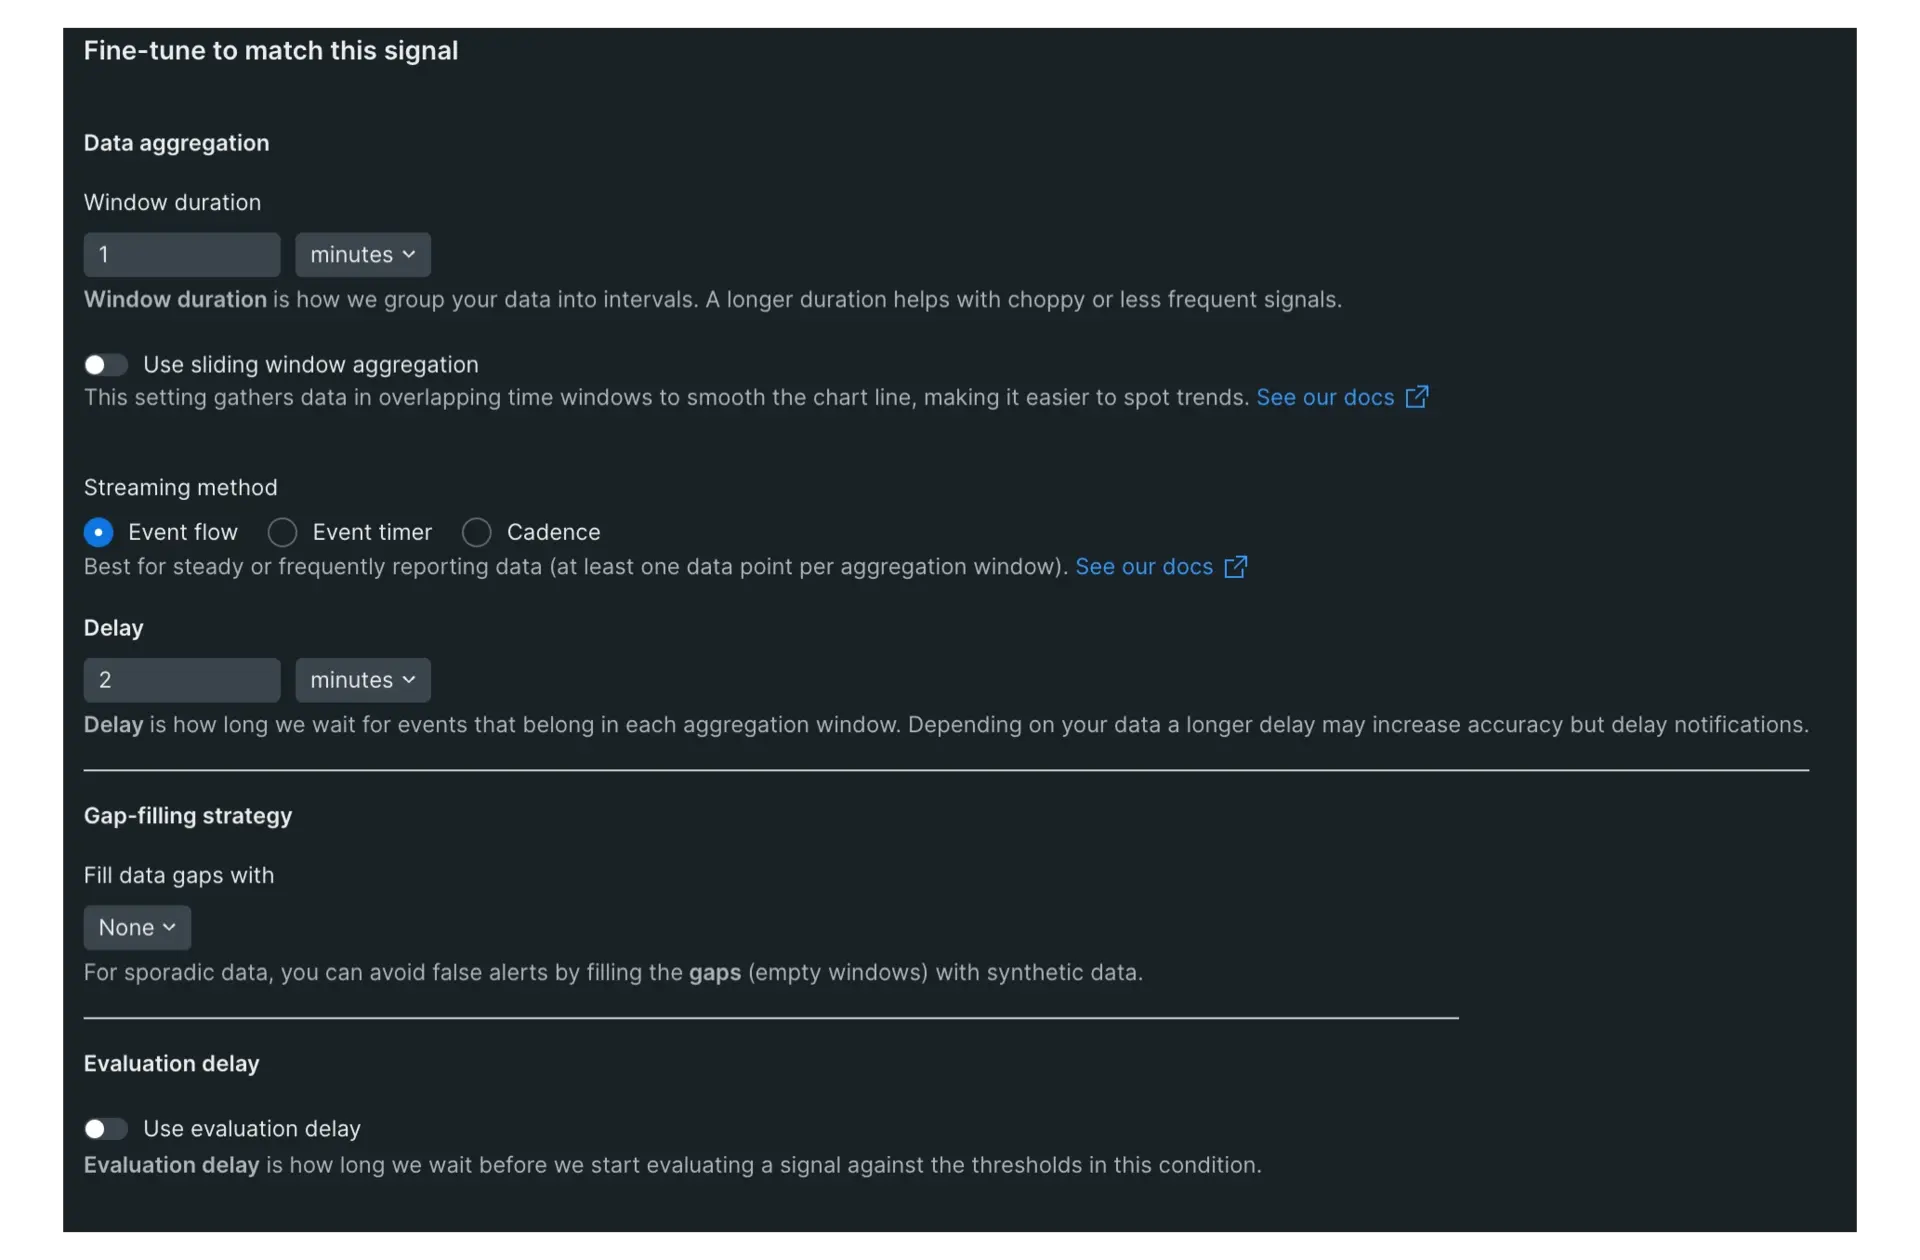
Set the data aggregation options:
- Window duration: Use the Window duration setting to determine how frequently we aggregate your data, such as groupings of every 5 minutes or every hour. This feature's setting depends on what kind of data you're monitoring. If you're unsure of what it should be, you can leave it at the default setting. You can learn more in our Create your first alert doc.
- Sliding window aggregation: Choose whether or not you want to use sliding window aggregation. This feature creates smoother charts when dealing with erratic data by creating overlapping aggregation windows. This feature is disabled by default, and we recommend keeping it disabled for your first alert
- Streaming method: The options most commonly used are Event flow and Event timer. Event flow is best suited for frequent and consistently reporting data, while Event timer is best suited for data that reports inconsistently, infrequently, or ingests in batches. If you want to learn more about the individual settings to see which method should be used in each scenario, see our docs
Set the timing option: This determines how long we wait for events in each window before we evaluate them. A longer delay will mean fewer false alerts, but it will also mean longer potential downtime before an alert event is open. This capability is also shown differently depending on the option you select: it's called Delay in the Event flow and Cadence options and Timer in Event timer. For your first alert, we recommend keeping the default time setting.
Select the gap filling strategy: Gap-filling is a reactive feature that fills blank periods in data reporting with user-defined synthetic value. If you believe the data reporting will be sporadic, you can avoid false alerts by filling in empty aggregation windows with this data. For your first alert, select None under Gap-filling strategy.
Select the evaluation delay: If used, this option enables a period of time for New Relic to wait before evaluating a new signal against your set threshold. It's useful for preventing false positive alert events when a data stream begins to report. For your first alert, you can leave it to the disabled toggle unless you know that this option applies to your data.
Select Next once you've finished to save your progress and move on to the next step.
Set the static thresholds
Start by selecting whether the threshold will have a status of Critical or Warning in the Security level section.
Set the limit that, when met, will open an alert event. These values will change depending on what you want the condition to do. For example, if you wanted to create a condition for an error message, you might set the threshold to equal to 1 at least once in 5 minutes, but if you wanted to create a condition for longer periods of latency issues, you might set the threshold to above or equal to 50 for at least 15 minutes.
If you want to add another threshold, select either Add threshold or Add lost signal threshold, depending on your needs. Lost signal thresholds are important for monitoring entities that may stop reporting or queries that may return null values.
Select Next once you've finished to save your progress and move on to the next step.
Add alert condition details
Add a name for your alert in the Name field. This will help you identify this condition, as well as find the condition in the future in case you need to edit or remove it.
Choose the policy for this condition to connect to. If you have an Existing policy, select it from the drop-down. If not, you'll need to create a policy by selecting New policy and creating it from here.
Set any of the additional settings for the alert. This includes setting how long until open alert events are automatically closed and entering any custom descriptions for the alert events.
Select Save condition to finish.
Create an alert using the classic alert builder
Dica
We recommend using the methods above to create a NRQL alert. If you would like to create a classic alert, you can use the original alert builder form.
From one.newrelic.com, select Alerts, then Alert policies.
Click on the policy for which you'd like to create the classic alert condition or create a new policy.
Select New alert condition, then select Build a classic alert.
Build your condition from any of the listed categories. This determines what the alert condition notifies you about.
Select a condition type to narrow down the options for the next step. You may also need to select a scope.
Select the entity or entities you want to monitor. Use the search bar to narrow down the entity list. If you selected an APM application metric type condition, you may choose to dynamically target applications that share certain tags.
Set your alert thresholds and any other condition settings. Name your condition, then save.
You've now created an alert condition! We offer different configuration options for alerts, so you can fine tune your alerts for your monitoring needs. You can also create conditions from NRQL queries, which we will cover next in this tutorial series.
Get more from alerting
We have some advanced alerting features that can help you make alerting more efficient and manageable for your team:
- If you want greater control over where and when you receive alerts and ensure the right people are notified about issues, see how to use Workflows.
- If you want to enable near-instant notification of critical alerts, helping you reduce your mean time to resolution (MTTR), see how to use our anomaly detection.
- If you want to use APIs to manage New Relic alerts, you can do so with either REST API or GraphQL.
