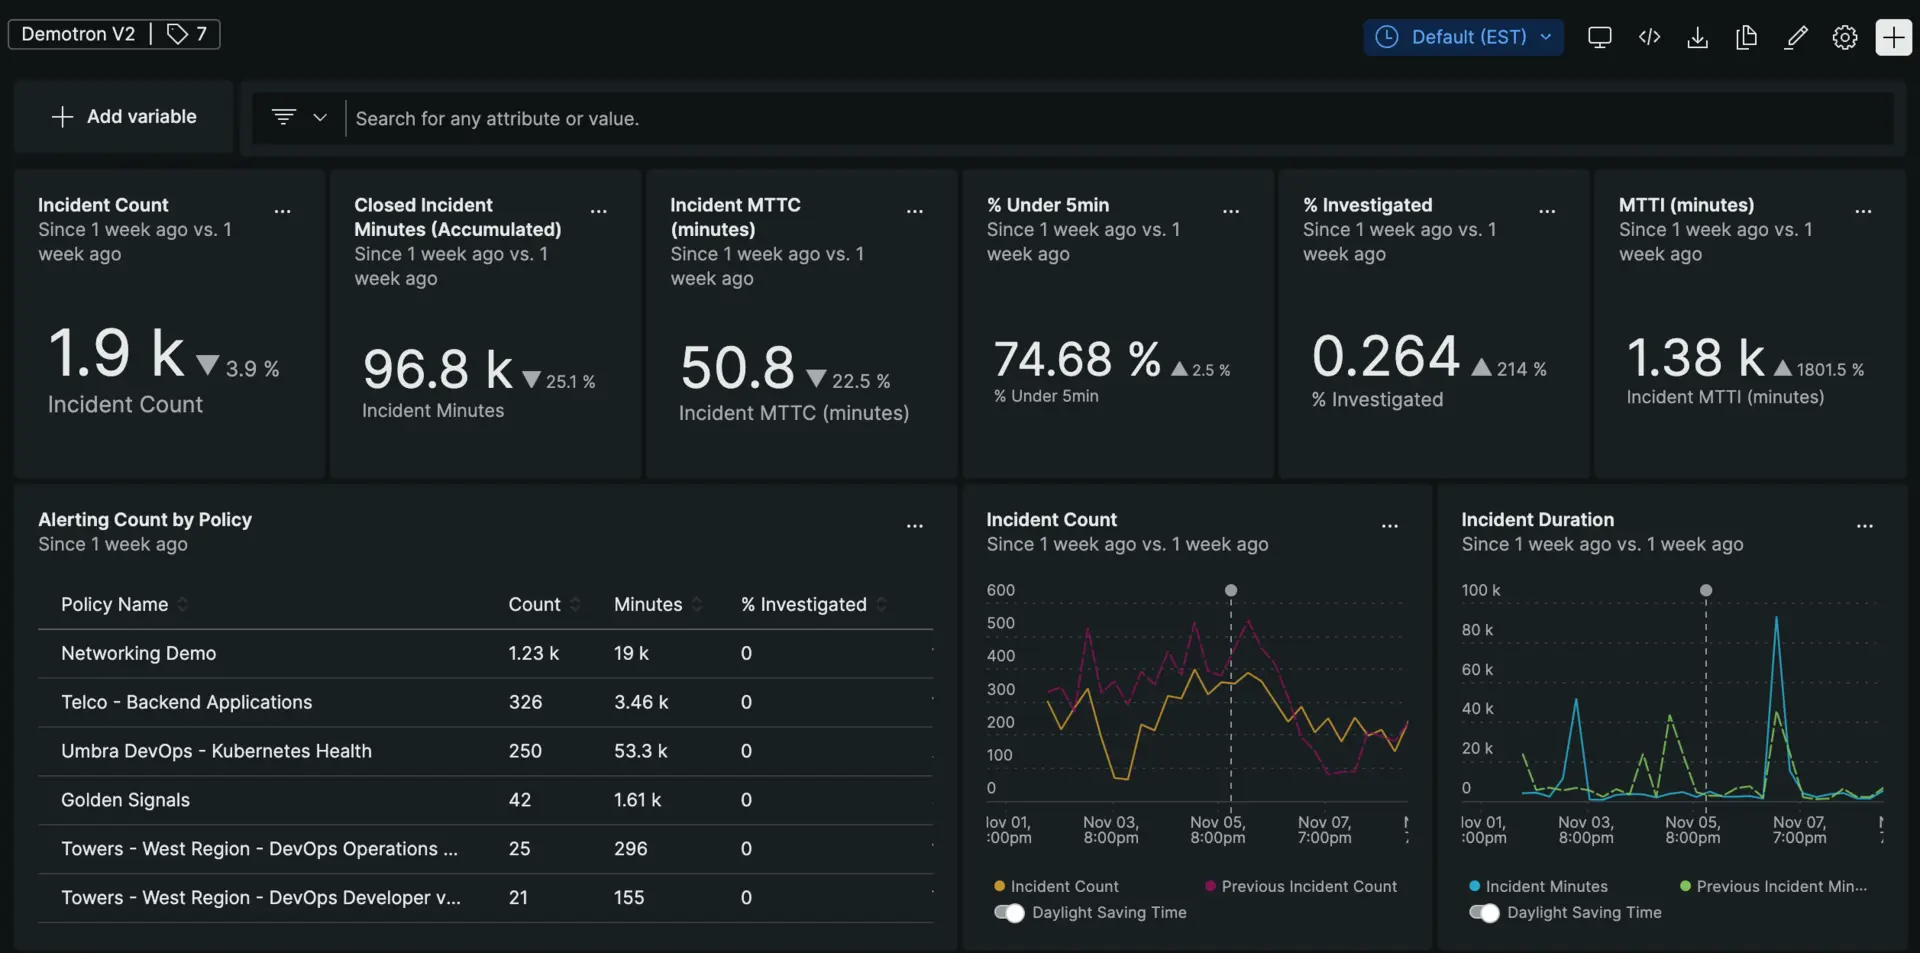
Redundant alerts bury critical alert events under noise. Assessing your existing alerts is a key part of your prioritization strategy, as the quality of your alerts translates into how well your teams respond to alert events. If there's too much noise, you risk fatiguing your team with low priority alert events that have little or no business impact. Alert events that fail to alert, however, lead to outages that affect customer experience.
Objectives
This tutorial assumes you already have active alerts. It offers some recommendations about managing the quality of your alerts and provides some NRQL queries for creating new ones. You will:
- Install the alert quality management (AQM) dashboard
- Differentiate between a good and bad alert
- Review our recommended NRQL strings for creating alerts
Install the AQM dashboard
AQM focuses on reducing the number of nuisance alert events so that your team focuses on with true business impact. You're a good candidate for AQM if:
- You have too many alerts.
- You have alerts that stay open for long time periods.
- Your customers discover your issues before your monitoring tools do.
To begin, install the AQM dashboard via our quickstart:
- Go to the Alert Quality Management instant observability page.
- Click on the Install now button.
- Follow the prompts to choose the account you want to install the dashboard into.
- View your dashboard.

We recommend you spend at least two weeks with the AQM dashboard. During that time, the AQM dashboard will collect data about how your teams interact with all of your alerts.
As a general rule, we recommend removing these types of alerts:
- Generate "always-on" alert events that have thousands of minutes or more of cumulative duration.
- Where 30% or more of alert events are open for less than 5 minutes.
- Whose mean-time-to-close is longer than 30 minutes.
- Create more than 350 alert events per week.
Create new alerts for peak demand
With your existing policies under review, you may want to create new alerts that are adjusted for peak demand. Creating a good alert depends on the specificity of your settings. Two alerts can share the same alert condition query, for example:
SELECT average(`apm.service.memory.heap.used`) FROM Metric WHERE appName = 'Inventory Service'While the query itself is a strong alert policy, how you configure this alert can create redundancy or noise. A bad alert may have too small a window duration, a low threshold, or no delay or baseline. Additionally, attaching an alert condition to a relatively young data source can also create problems, as there's not enough history to detect anamlous behavior.
If you're ready to create new alerts, here are some recommended queries you can use for your gameday: