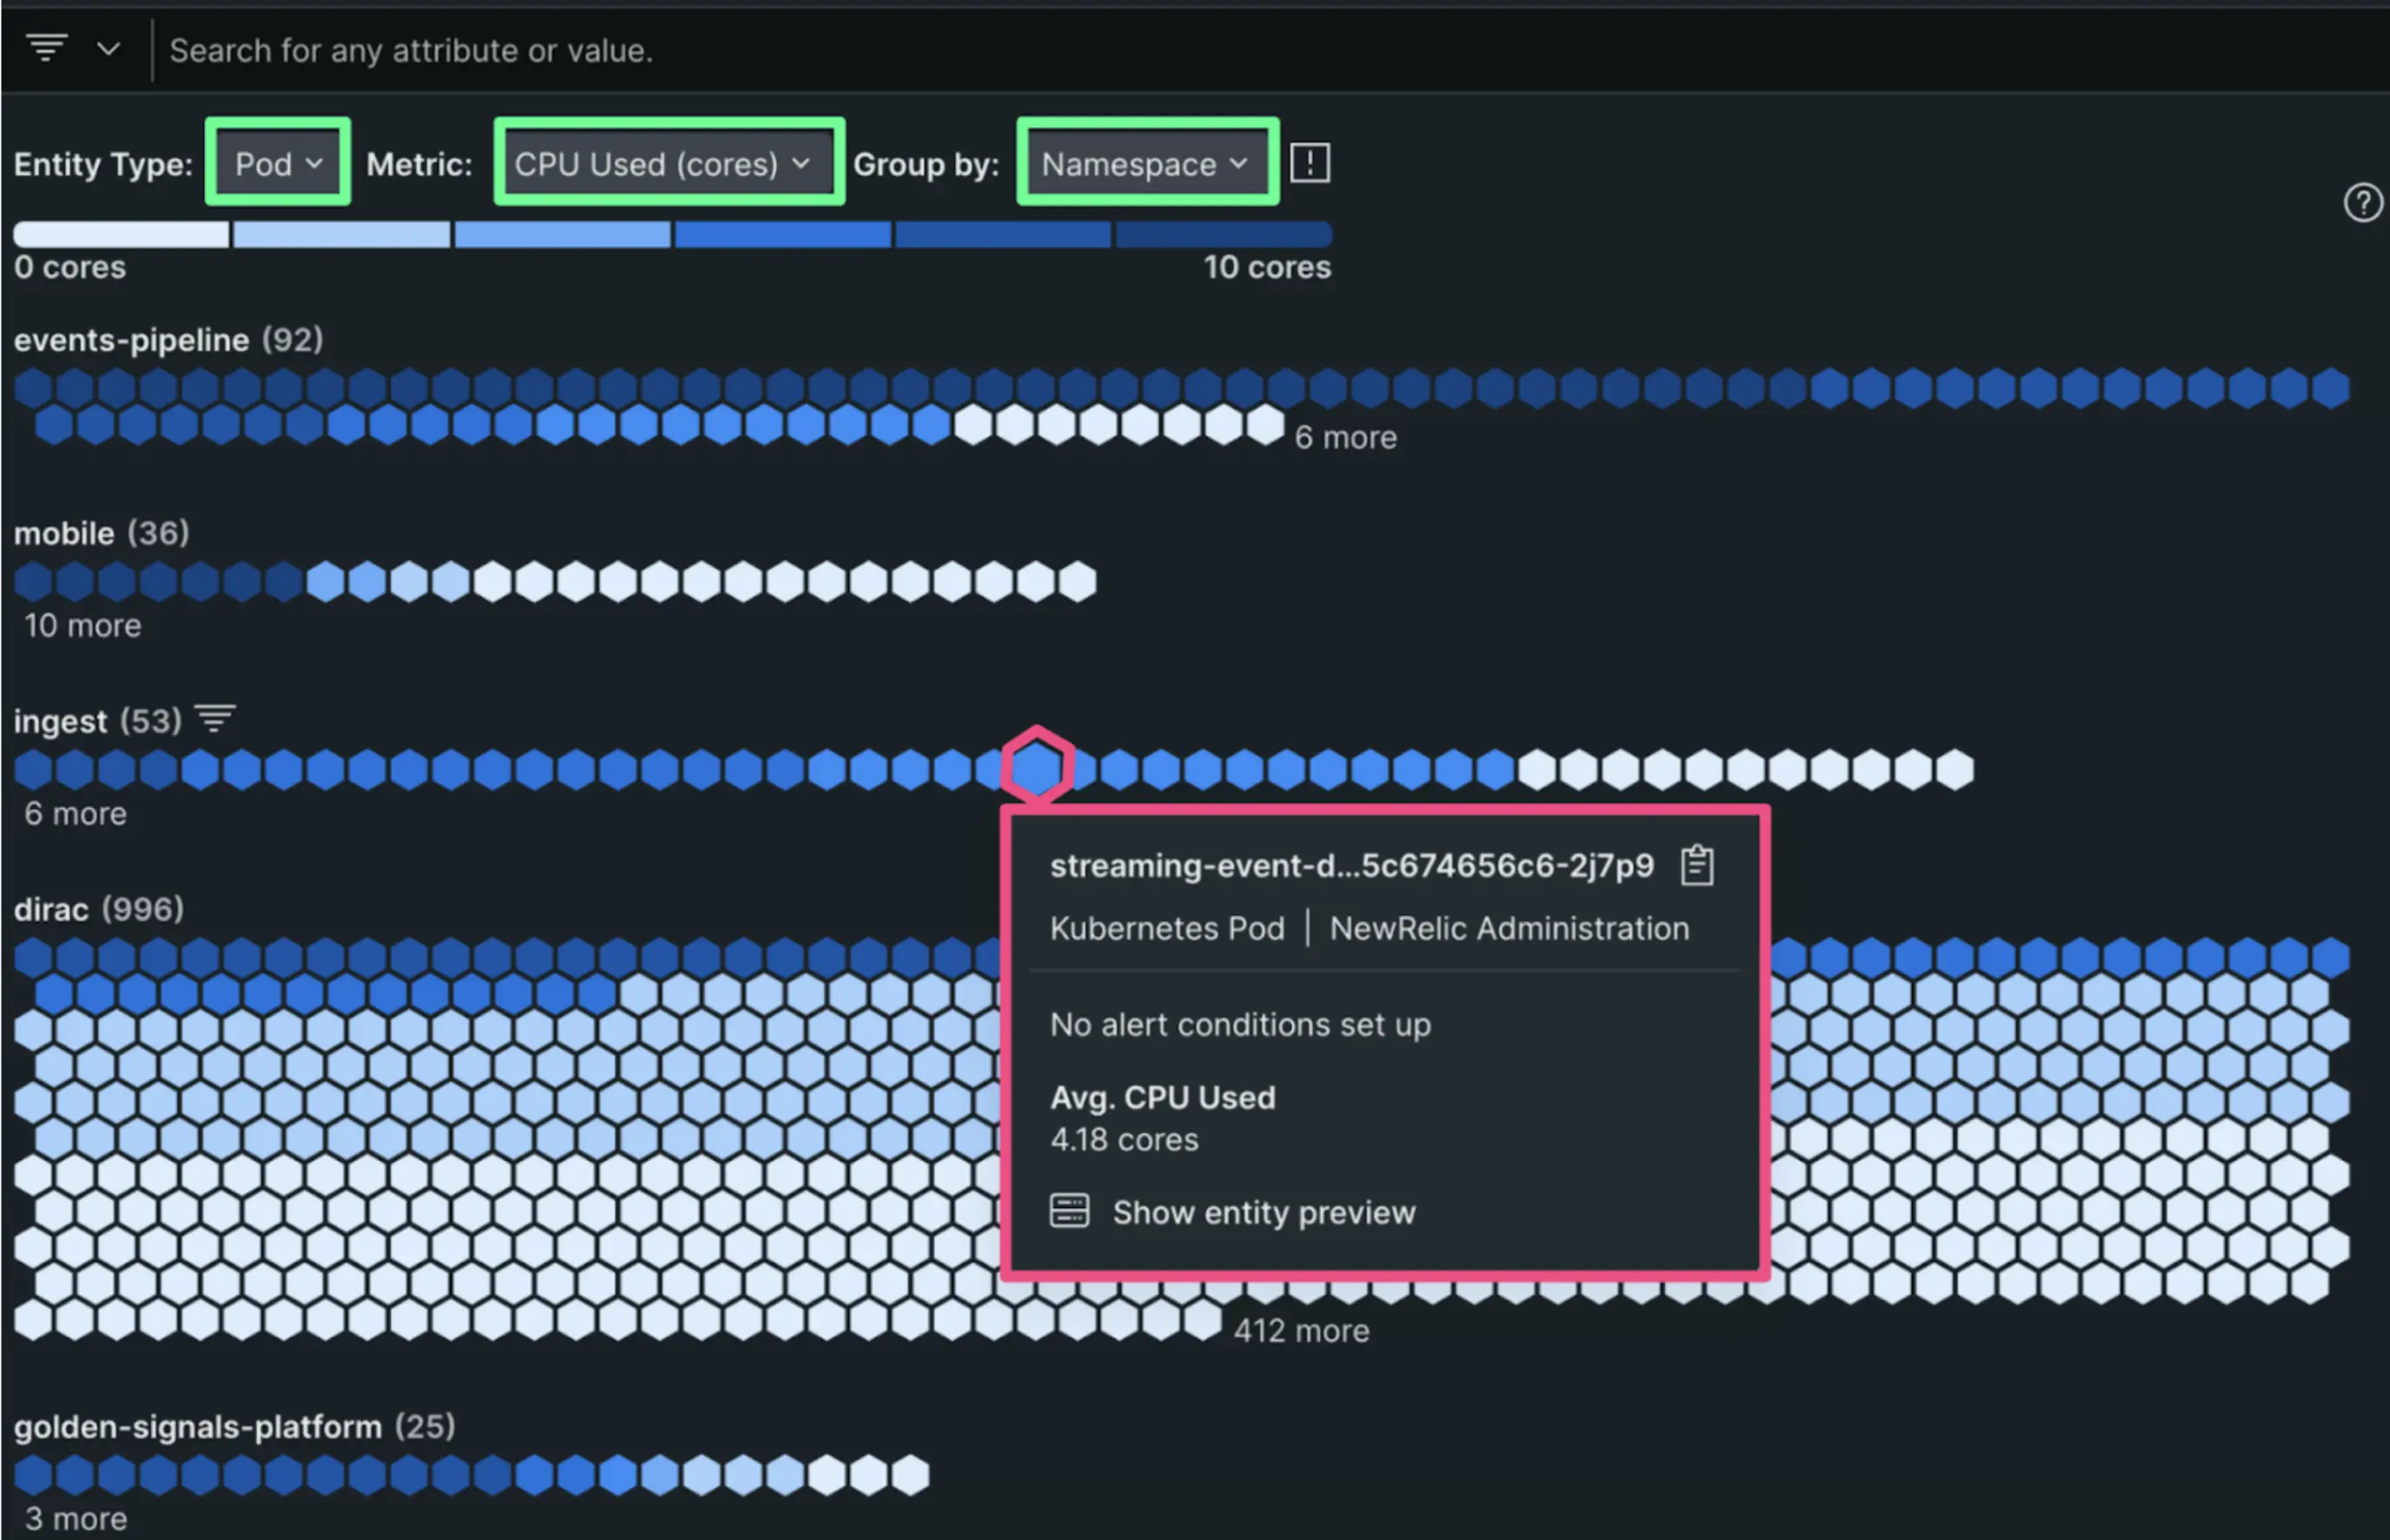
We've completely rebuilt our Kubernetes experience to give you a new UI that scales with large clusters. And with user-selectable drop-downs, you can now slice and dice your data in powerful new ways to dynamically analyze your performance.
Key features
- See everything at-a-glance: Quickly understand overall cluster health with a completely redesigned visual experience that scales with large clusters.
- Explore performance dynamically: See performance in a gradient view of user-selectable Entity Types and Metrics, Grouped by Namespace, Deployment, Pod, and Node (more coming!).
- Go beyond nodes and pods: Analyze your cluster's performance broken down by Deployments, Statefulsets, and Daemonsets.
- Support for new entities: Understand the status and performance of Jobs, CronJobs, PersistentVolumes, and PersistentVolumeClaims (more coming!).
- K8s operator: Get a standardized and easy way to install, manage, and upgrade New Relic's K8s solution.
How to get started
- Log into New Relic and select Kubernetes
- Select the toggle next to Preview the new Kubernetes experience (New)
- Read the documentation to learn more.
