Maintaining a website combines the efforts of multiple teams. When outages happen, developer and engineering teams can resolve issues directly, but a digital marketer may not have the same access to site administration. As a digital marketer, your team's success is just as dependent on site performance, but you might not have the tools to identify or address any issue yourselves.
Our website performance monitoring (WPM) tool gives insight into your site's availability and performance. With out-of-the-box and routine checks from our monitors, you'll never be uncertain about how your site performs.
Once data has been collected, you'll be able to view different charts that track user details about your page's assets. Taken together, they can help you understand how your users experience your site.
Objectives
This doc helps you set up our codeless website monitoring tool, then walks you through understanding your data. In this tutorial, you will:
Once you've chosen pages to monitor, New Relic deploys a set of monitors from different servers around the globe that checks your page for website availability, broken links, performance, and SSL certificate expiration. To get started, we recommend choosing your homepage.
New Relic will take a few minutes to deploy the monitors, then you'll start receiving data about your website. Keep in mind that your monitors only check the performance of pages you've manually added.
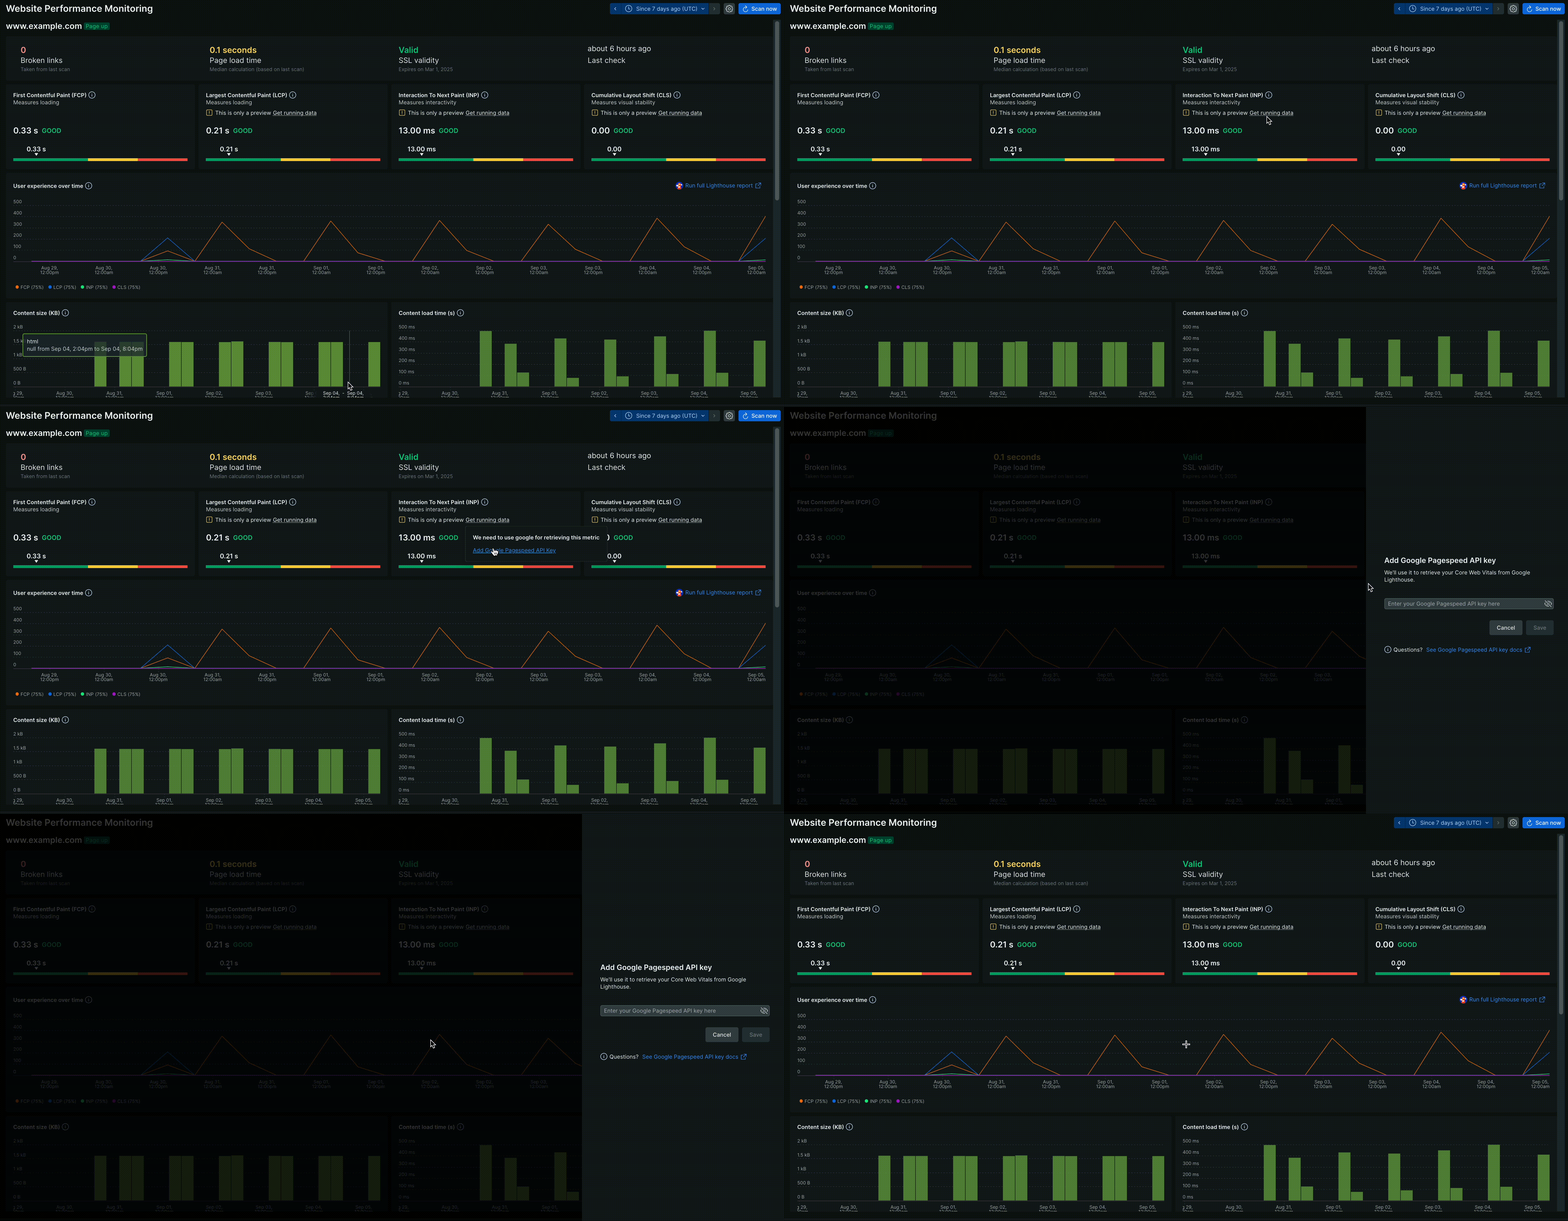
Add Google PageSpeed API key
We draw core web vitals from Google's API so that scores in New Relic match what you have in Google. To continue capturing these scores after initial setup, you'll need to create a Google PageSpeed API key.
Put your data in context
Once your monitors report data to New Relic, you'll see metrics that can help you improve user experience and SEO ranking. Below are examples of the kind of data you'll see on your summary page.
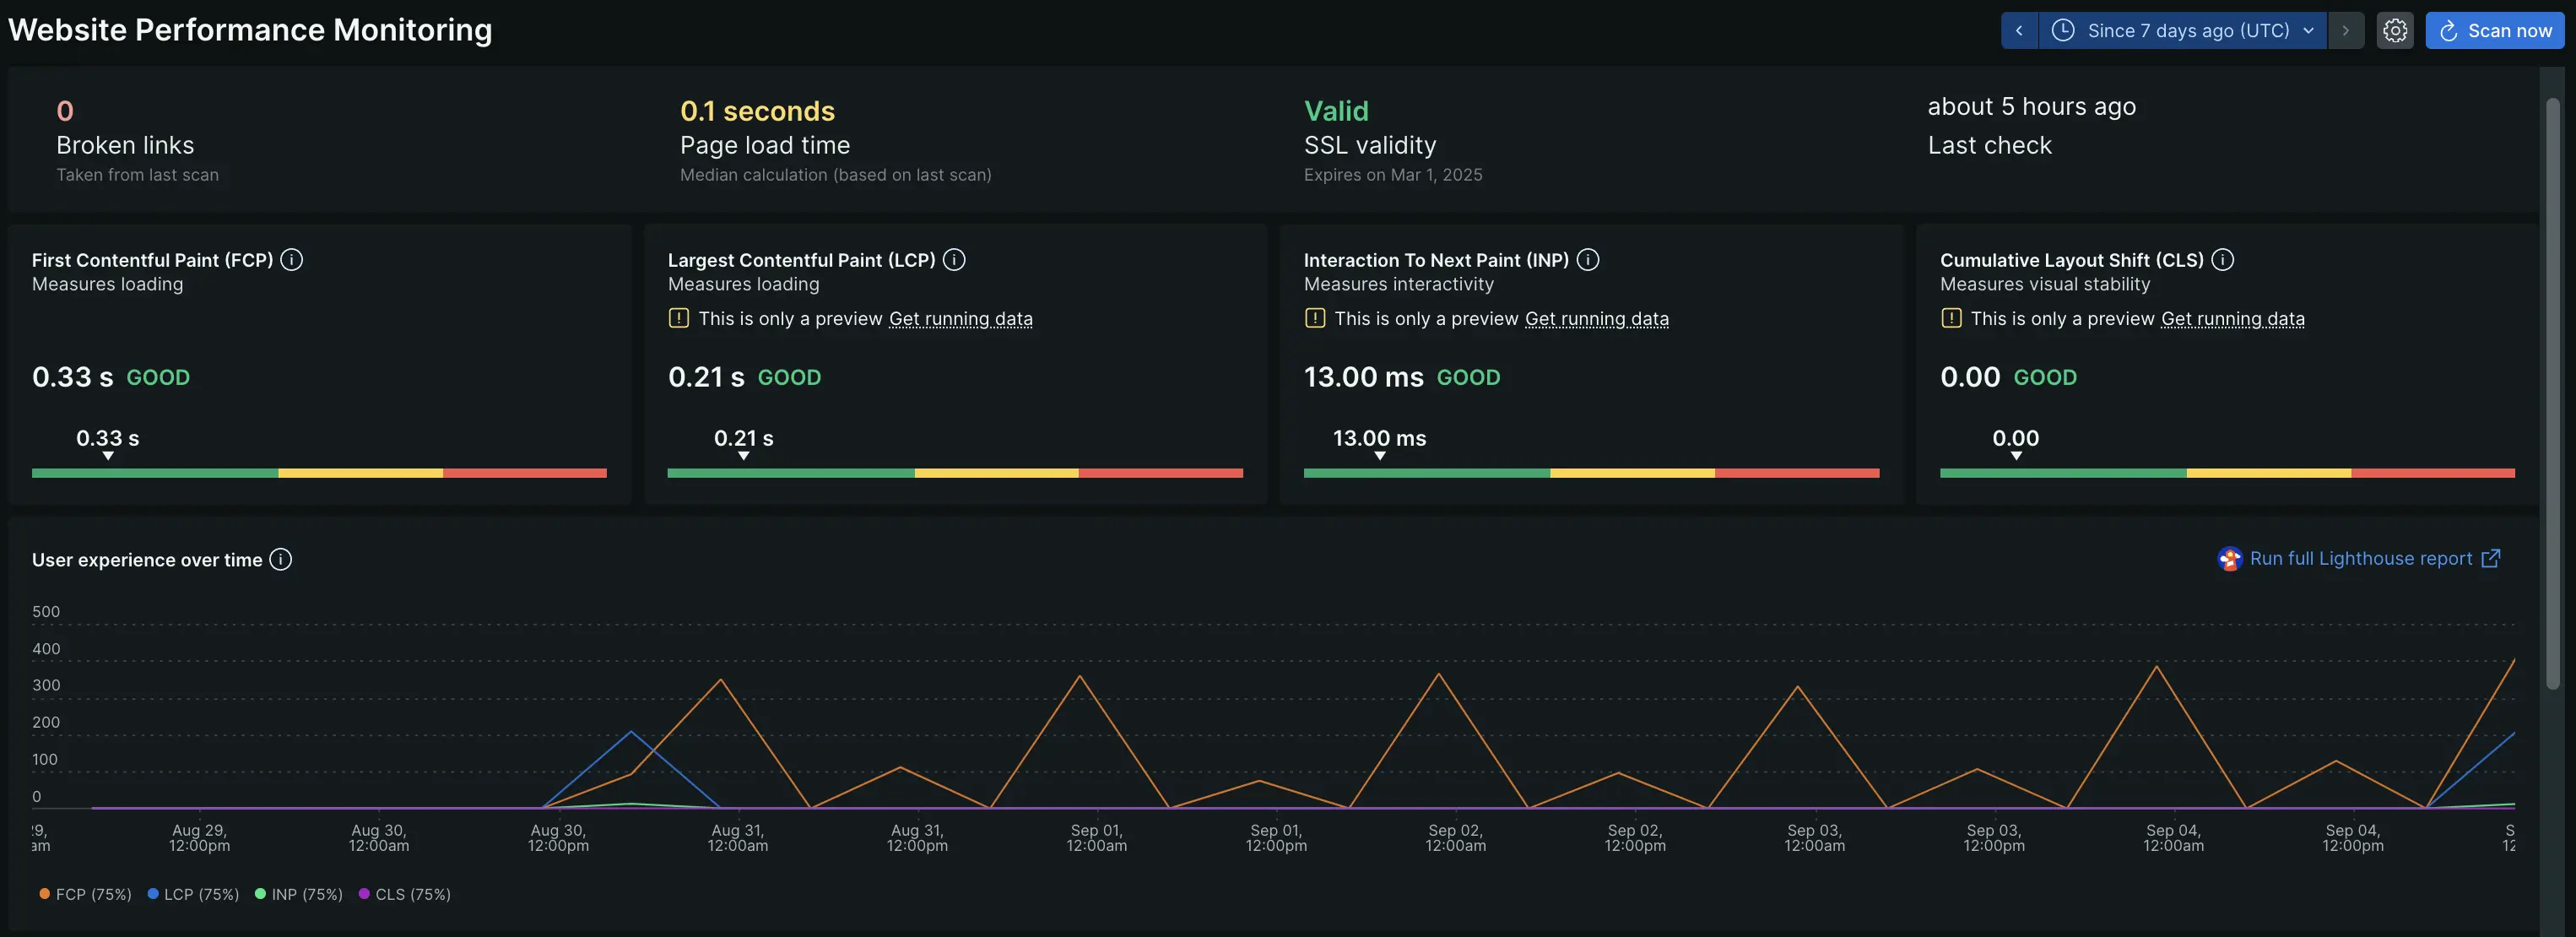
The first section shows you ping data. This kind of data is an availability check, confirming basic site functionalities:
Site availability. This reports whether your page has loaded at all. If it hasn't, there might be an issue with your servers or domain.
Page load time. This collects the median speed for how long it takes your page to load all of its assets. This data gets further broken down by content type and size.
SSL Validity. This tells you whether your SSL certificate is valid, expiring, or expired. It'll include the date you need to renew your SSL certificate as well.
Broken links. After testing all the links on your page, it'll report back which links are broken.
Our monitors capture site behavior via monitors that interact with your site. This lets you see updated data on a day-to-day basis so you never have to guess when assets or pages fail to load.
WPM optionally pulls your core web vitals from Google's PageSpeed API on the same schedule as your other synthetic checks. This gives you a periodic, high-level read on performance, but it isn't a live feed from your actual visitors. If you need to see how real users experience your site on their own devices and networks, see What's next for how to add real user monitoring alongside WPM.
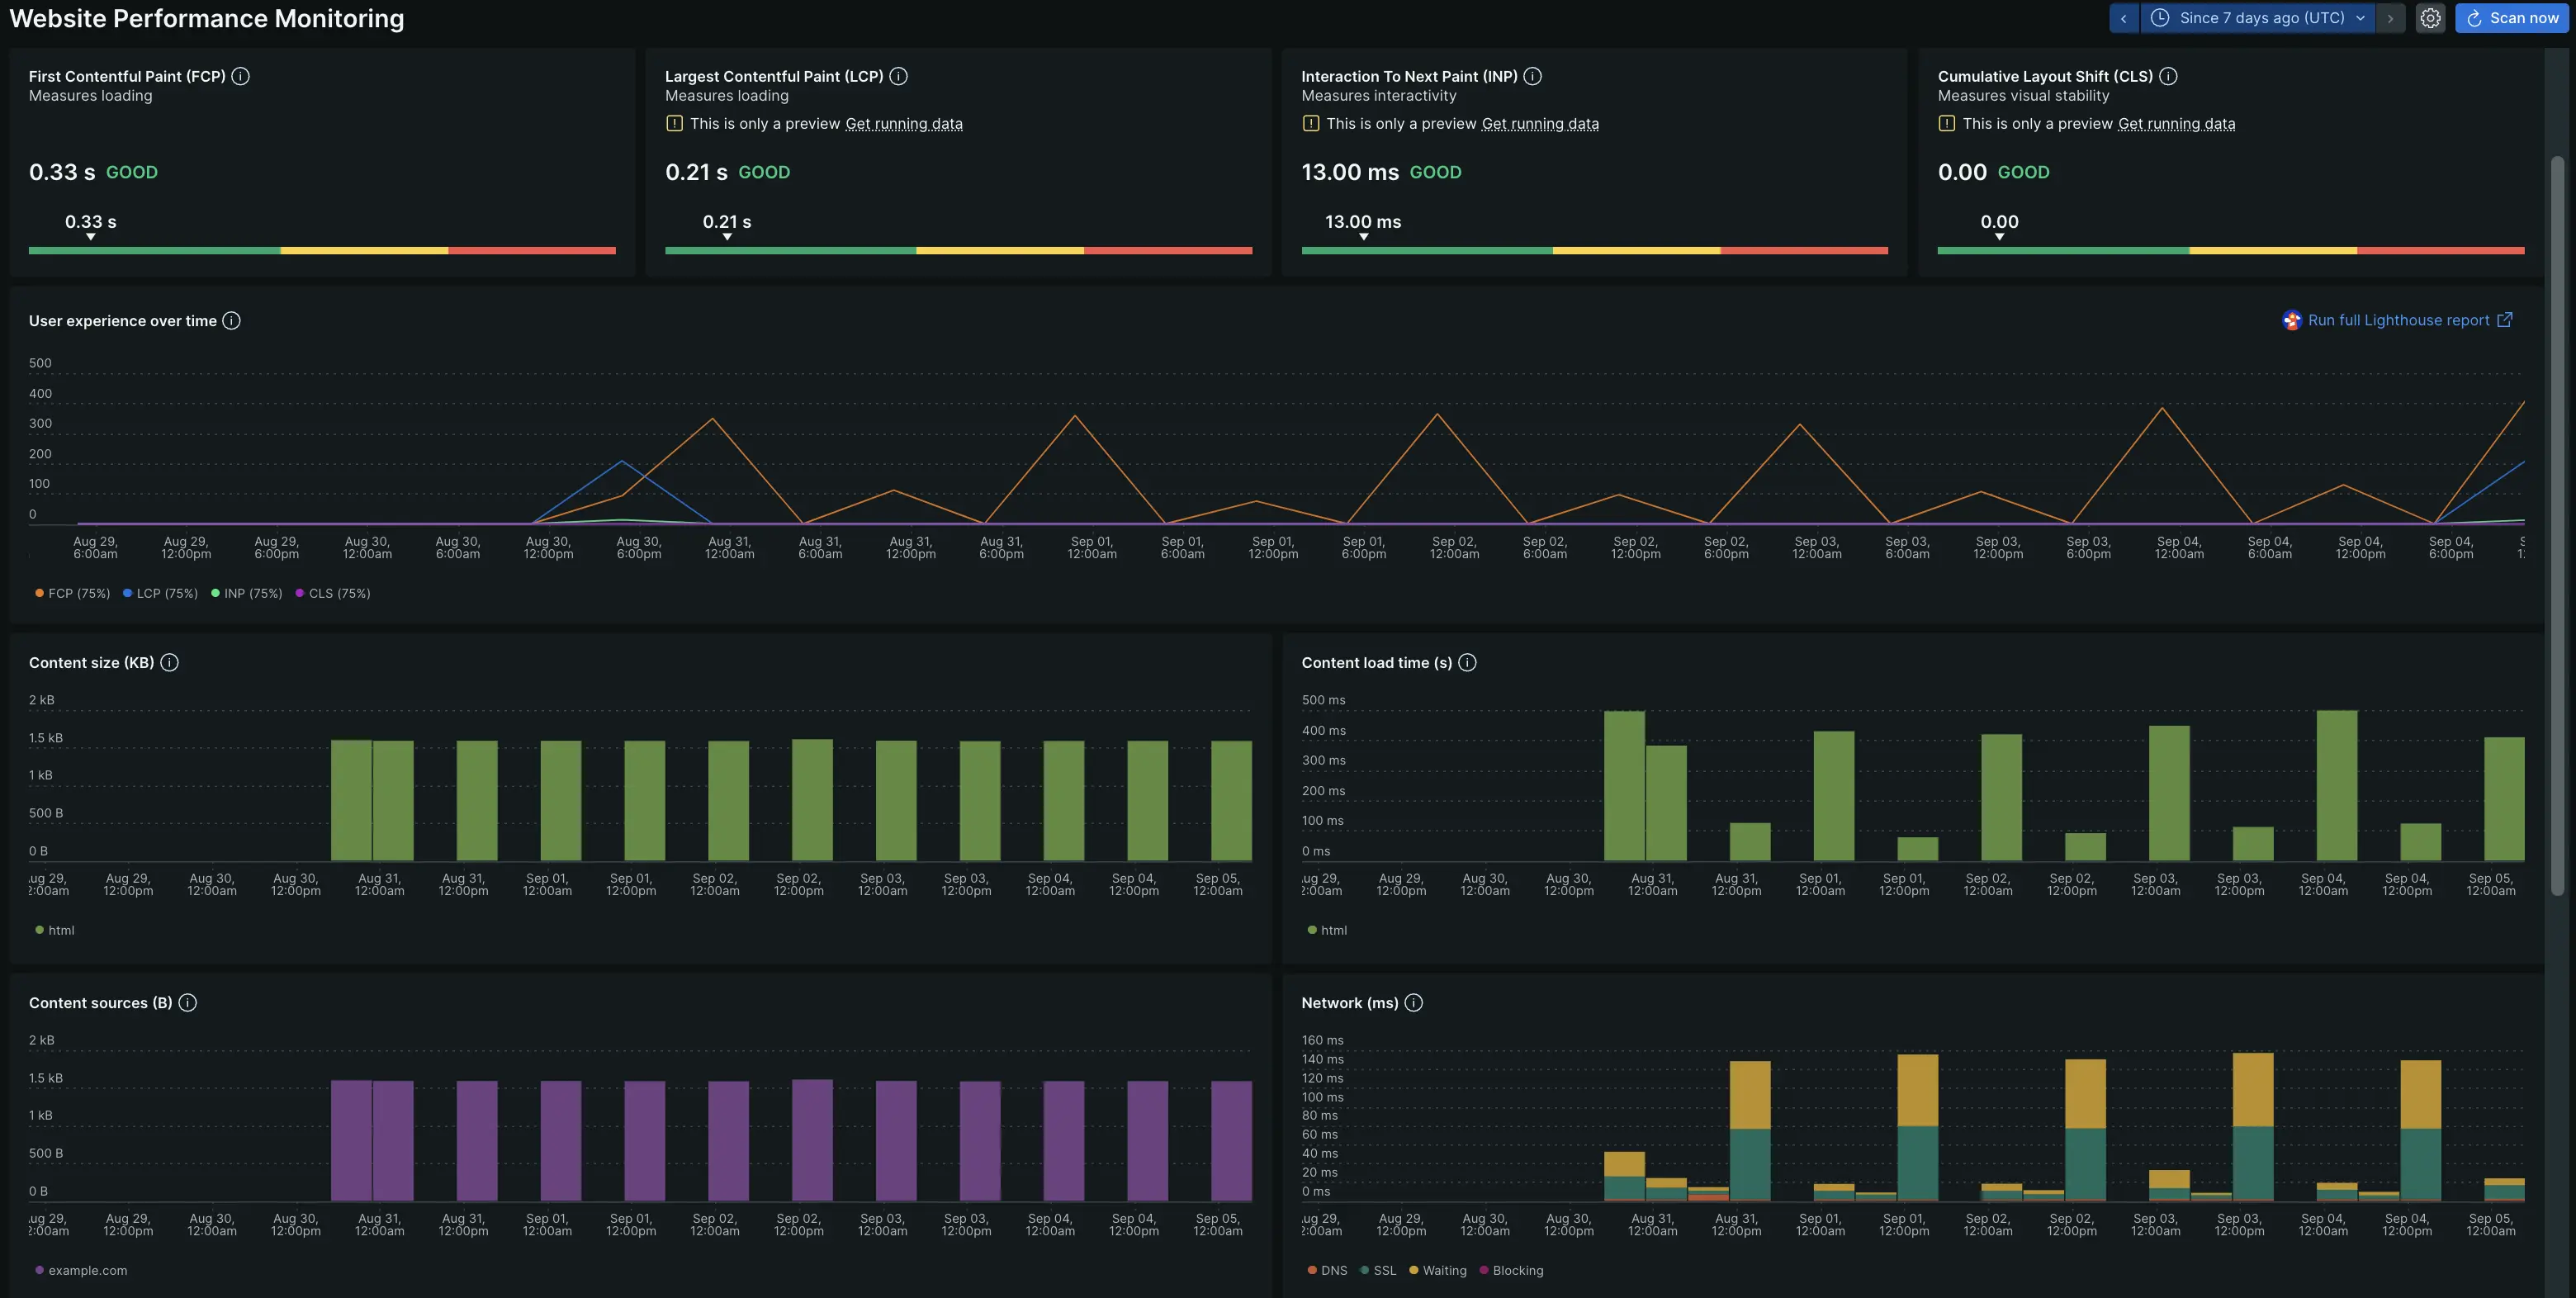
First contentful paint. This captures the time it takes for the first asset to load on a page. In the above screenshot, it took the site 3.22s for something to load on the page.
Largest contentful paint. Unlike first contentful paint, this captures the time taken for the largest content on the page to fully load. For example, if information about an important campaign appears in a page's largest asset, then this number tells us how long a user waits before seeing it. In the above screenshot, it took 2.79s.
Interaction to next paint. When a user interacts with an element on your site, it takes time to process the user's interaction This number captures that time as a delay between the request (user interaction) and response (how the page changes based on the user request).
Cumulative layout shift. This measures visual stability of different assets on your site. For example, after a user goes to your site's main page, images may shift while loading. This movement is unanticipated.
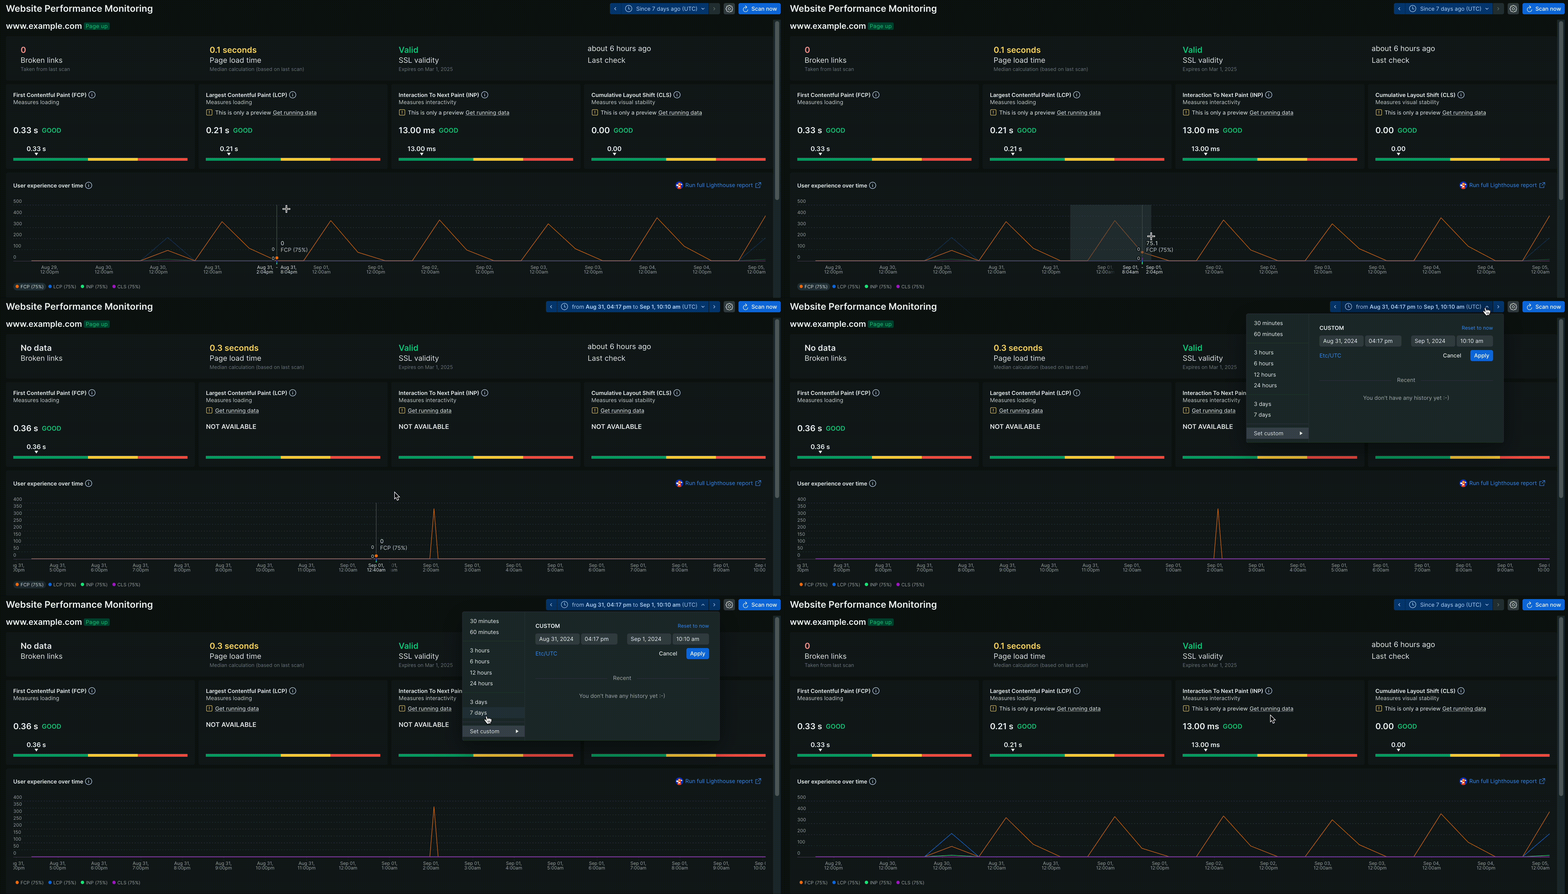
We collect data over time so you can get a richer picture of your site's performance. You can zoom in and out of windows of time and see how your data changes around a particular incident, like in the gif above. When you're finished, click the time stamp button at the top to adjust back to your preferred time period.
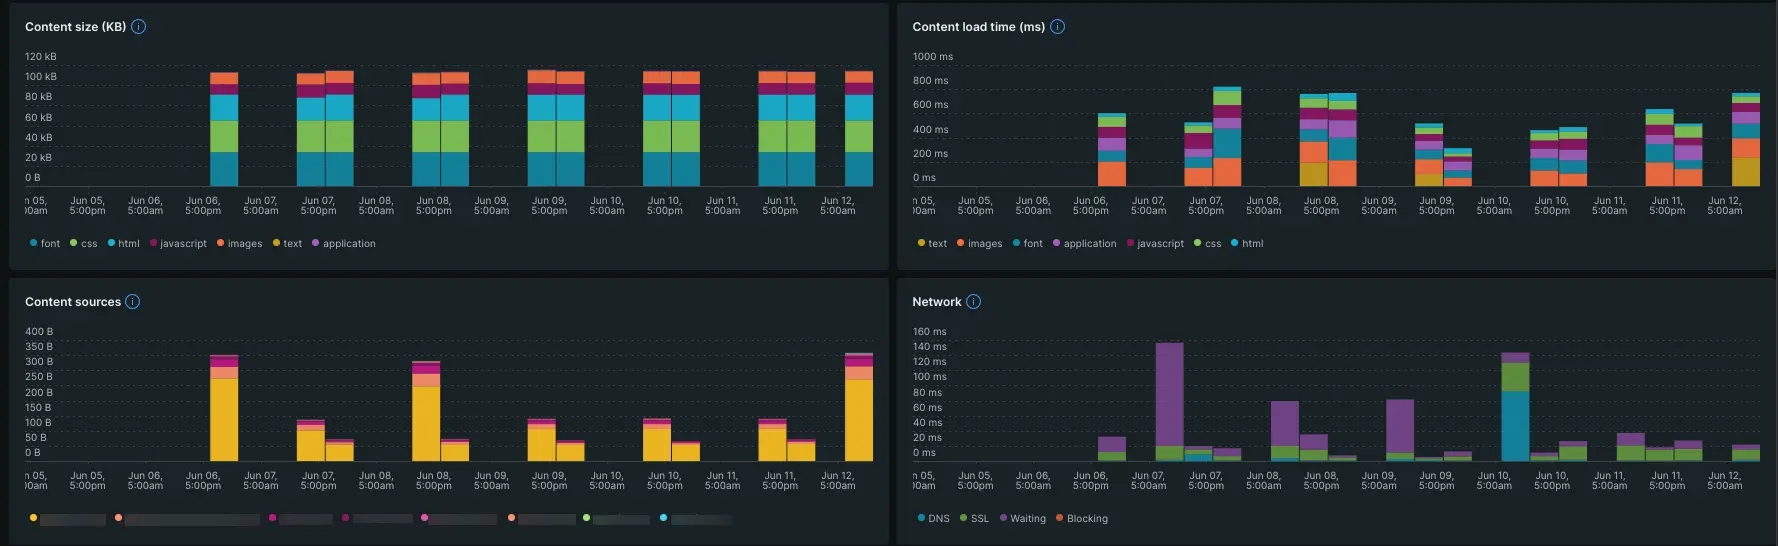
Your webpage is made up of different types of content, like HTML, images, JavaScript, and videos. Our content charts show you how different content types perform relative to one another. For example:
Content size shows you the size in kilobytes of each type. Referring to the above chart, you can see that your JavaScript content type is proportionally smaller than your images on a given page. If your site's performance is down, you can request that your dev team optimizes your site on the code-level.
Content sources breaks down where your content is hosted by size. For example, in the above chart, the bulk of your content is sourced from New Relic, represented by the yellow. If your content is optimized but still broken on your page, then changing where you're sourcing your content could resolve that error.
Content load time shows how long it takes a given content type to load relative to the entire page's load time.
Network breaks down how content is delivered to the page and how much time it takes to deliver that content.
If your page is loading slowly, then you can use the Content section to diagnose potential sources of the problem. For example, comparing Content size to Content load time can give insight into whether CSS is taking up too many resources and loading last, which would cause a delay in largest contentful paint. If content size is optimal but page load is still slow, perhaps it's a network or source issue.
If user engagement is down but your site is available and content is optimized, then something else might be at play. A possible journey to troubleshoot might look like:
Check the availability of your page. It reads as available.
Your core web vitals are reporting as Good across the board.
You notice timeslice data shows a steep drop-off in traffic the day before, around the time your team made updates to your landing page.
You notice a broken link has been reported. It's a link inside a banner that's used across your site.
At this point, you can coordinate with the relevant teams to fix the broken link and deploy an update for the rest of the site.
What's next?
Website performance monitoring offers a no-install read on your site's availability and core web vitals — useful when you don't have engineering access to your site. It's inherently a synthetic, low-frequency check: Monitors run periodically from a handful of external locations, and core web vitals come from Google's PageSpeed API rather than your own visitors.
For an always-on picture of how real users experience your site, add browser monitoring. It instruments your pages directly, so every metric comes from actual visitor sessions instead of periodic samples.
Here's how the two compare:
Website performance monitoring
Browser monitoring
Data source
Synthetic checks + Google PageSpeed API
Real visitor sessions
Setup
No install
Install the browser agent
Core web vitals
Periodic, lab-based
Continuous, from real users
Breakdowns
None
By browser, device, geography, and more
Error and session detail
Not available
JS errors, session traces, and session replay
We recommend WPM as a baseline check (uptime, broken links, SSL expiration) and browser monitoring as your source of truth for actual user experience and core web vitals trends. To get started:
Break down performance by browser type and geography to find issues affecting only part of your traffic — something a handful of synthetic vantage points can't surface.