New Relic monitoring for SAP includes out-of-the-box monitoring components: dashboards, alert policies, and the IDOC Explorer.
Before you begin
To perform these tasks, you must have New Relic Admin privileges on the account.
Important
For the SAP Cockpit dashboard, you must create a lookup table named NR_LKUP_SYSTEM before installation.
Locate SAP monitoring components
- Go to one.newrelic.com. If you manage multiple accounts, select the sub-account that collects SAP data.
- Select + Integrations & Agents > Apps & Visualizations.
- Search for SAP. Results show all available apps, alert policies, and dashboards for SAP monitoring.
Install dashboards
Create lookup table
Tip
Only required for the SAP Cockpit dashboard.
The SAP Cockpit dashboard uses a lookup table for SAP systems and their environments.
Create the lookup table with two columns:
SYS_IDandEnv, and save it as a CSV file. Here is a sample of the lookup file:SYS_ID,EnvGD1,DEVSD2,DEVAQ1,TestingAQ2,TestingSP1,ProdSP2,ProdGo to Log > Lookup Tables.
Click Add a table.
In the Add a lookup table sidebar, name the table NR_LKUP_SYSTEM, and upload the CSV file. See Lookup tables for more information.
To verify the table content, use the query builder with
FROM lookup(NR_LKUP_SYSTEM) SELECT *, then click Run.
Install the dashboards
- Go to one.newrelic.com > Integrations & Agents and search for New Relic Monitoring for SAP Solutions. Alternatively, go to Dashboards > Recommended Dashboards, click View all, and search for SAP. See Dashboards for more information.
- Select the Dashboards tab.
- Click a dashboard and select the account where you want to install it. The dashboard installs automatically.
- Install these dashboards:
SAP Dashboards
SAP Cockpit
SAP Data Collection Monitoring
SAP Data Ingestion Estimate
Tip
After you install the SAP Cockpit dashboard, open it and confirm that the landing page reflects the correct system status. This verifies that the NR_LKUP_SYSTEM lookup table maps your environments to systems correctly.
Add dashboard filter
- Go to one.newrelic.com > Dashboards and select a dashboard.
- Click the ellipsis (…) in the upper-right corner of a widget.
- Select Edit to open the edit screen.
- Toggle the Filter the current dashboard switch.
Enable facet linking for table, pie chart, and bar chart widgets to filter by SAP system, instance, IDOC status, jobs, and more.
Install alert policies
Go to one.newrelic.com > Alerts > Alert Policies.
Search and click New Relic Monitoring for SAP Solutions alert policy.
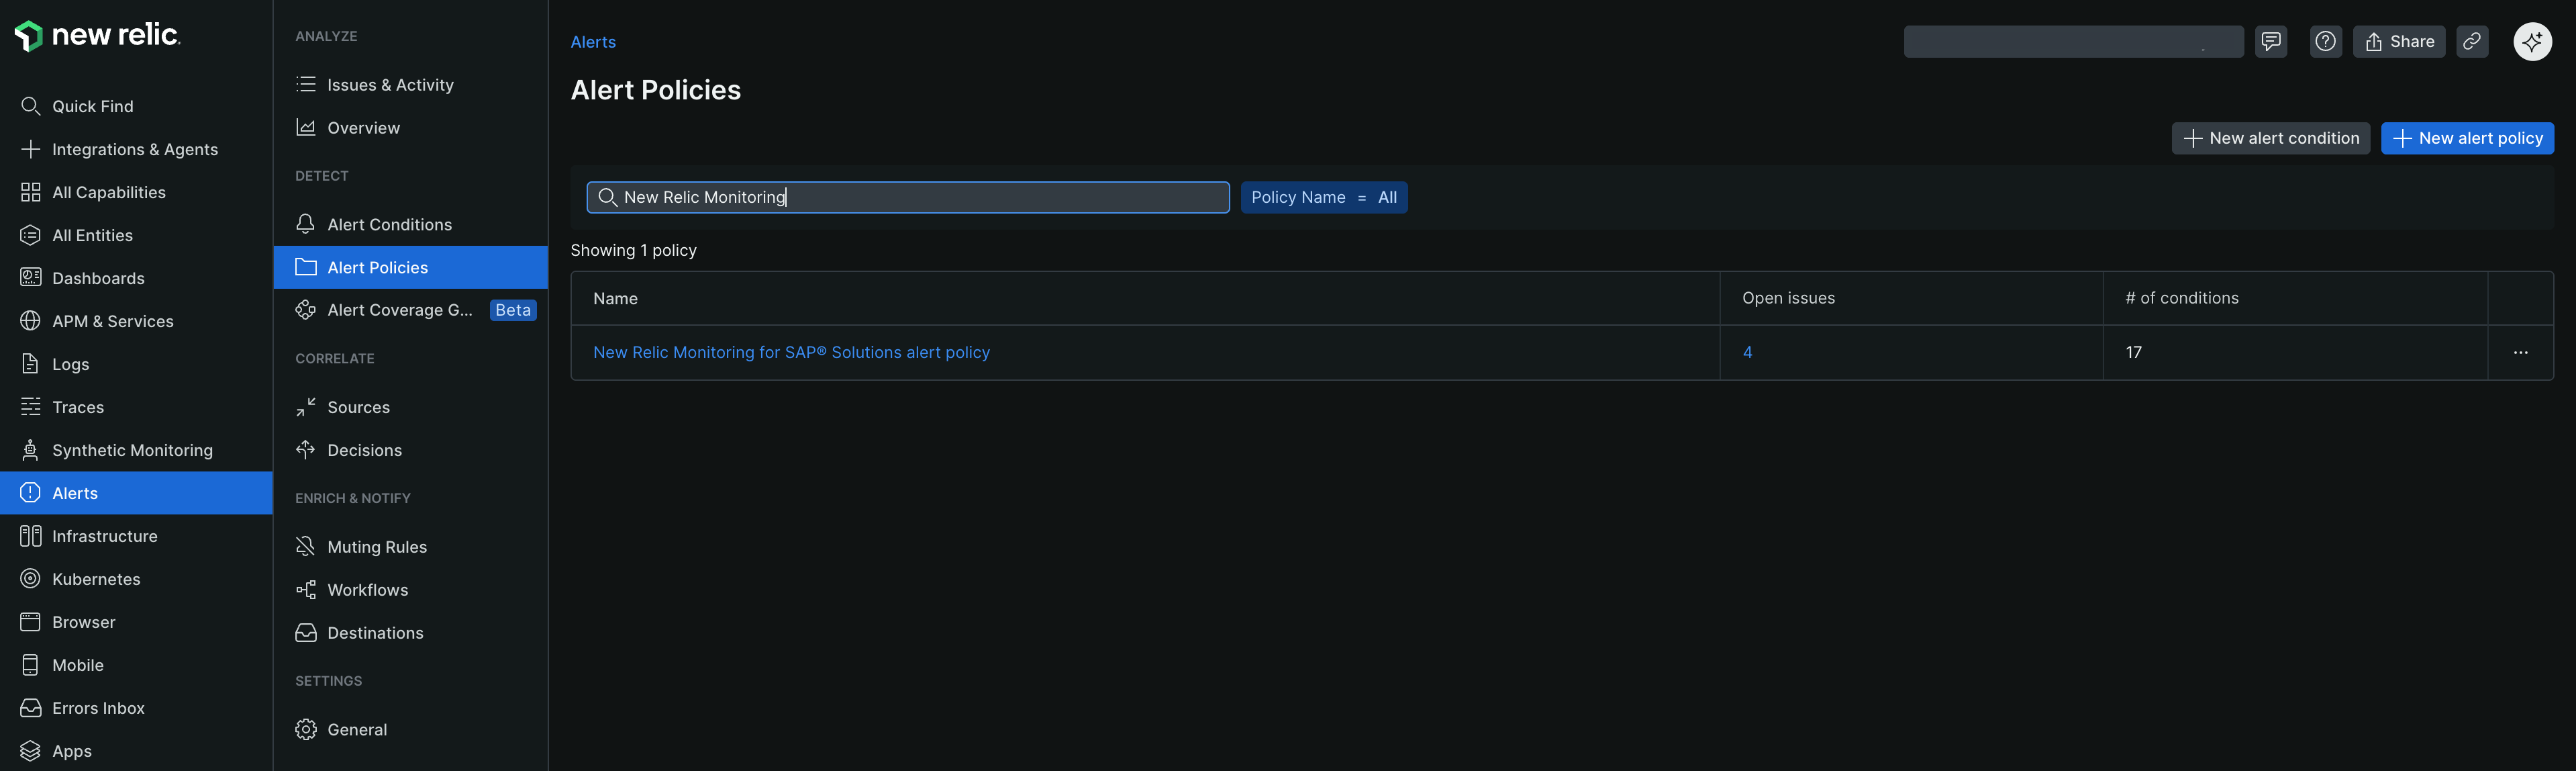
In the Alert condition tab, select the account and toggle the alert policy to Enable. See Manage your policies for instructions on managing policies.
Go back and search for Nr4sap default alert policy. Toggle on the alert condition you'd like to enable.
Install IDOC Explorer
Go to one.newrelic.com > Integrations & Agents.
Select Apps & Visualizations, and search for IDOC Explorer.
Select Manage access. Choose the account for access to the app.
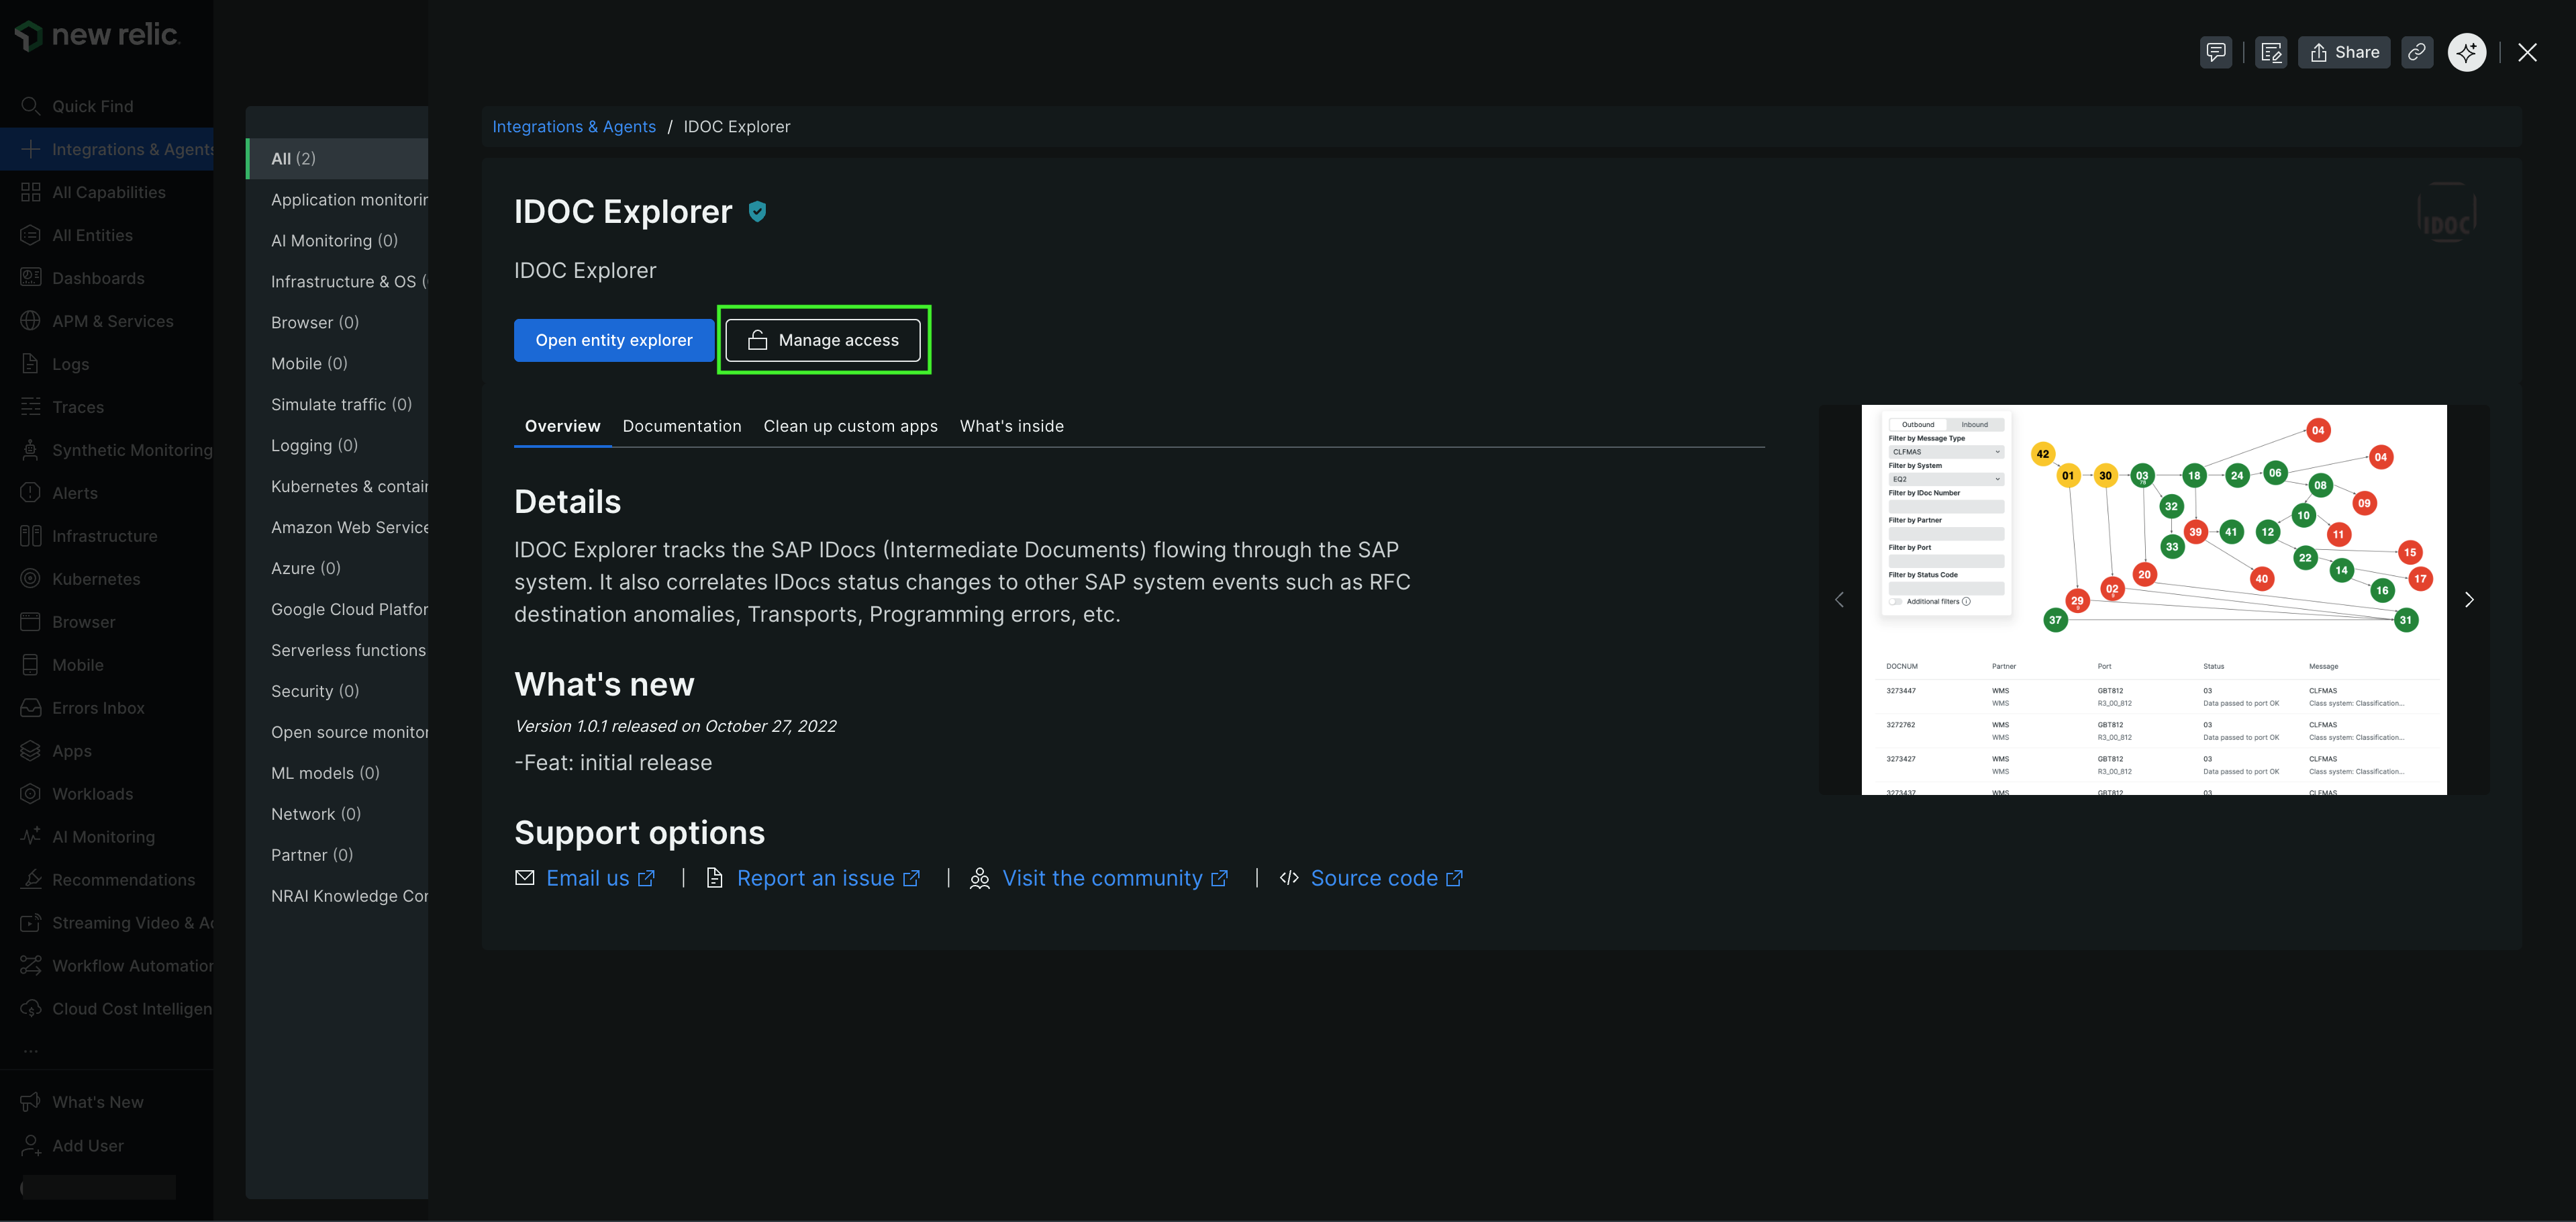
Click Update. The IDOC Explorer appears when you view IDOC entities.