After installing the ABAP add-on, use the /NEWR/INSTALL menu to connect your SAP systems to New Relic, configure API endpoints, define monitoring groups, and verify the setup.
Use /NEWR/INSTALL menu
- Log in to the production client of the central monitoring system.
- Type
/nin the command field and press Enter to go to the SAP Easy Access root menu. - Type
/n/NEWR/INSTALLin the command field to open the/NEWR/INSTALLmenu.
Before configuring, ensure the following:
The installer has proper authorization to perform the configuration.
The
/NEWR/*parameter is added to theS_TCODEauthorization object in the installer'sprofile/role.팁
If upgrading from a previous version, refer to Upgrade from Previous Version to determine which steps are necessary.
Connect systems
중요
Complete any pending configuration steps before proceeding.
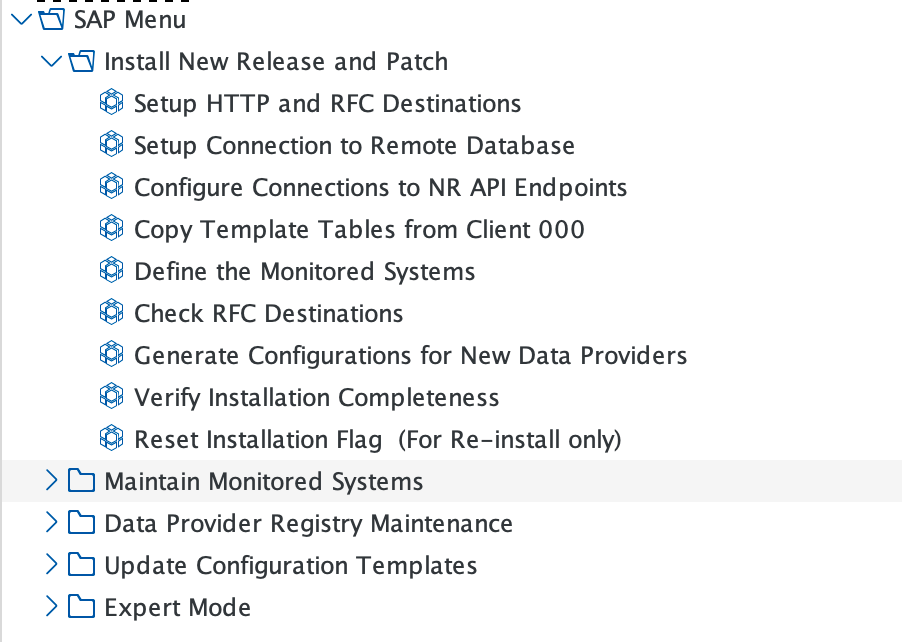
In the /NEWR/INSTALL menu, open the Install New Release and Patch folder and complete the following steps.
Standard RFC destination configuration
Use transaction SM59 to set up RFC and HTTPS connections for on-premises monitored systems:
- For RFC setup, see Standard RFC Destination and Set HTTP destination to New Relic cloud.
SAP Cloud / Business Technology Platform (BTP) RFC configuration
Use transaction SM59 to set up HTTP destinations for BTP-hosted systems:
- For BTP/CALM authentication, see Cloud (BTP) RFC Destination.
- If you monitor an SAP Cloud Connector, configure an RFC destination of type G (External HTTP) using port 8443 (default Cloud Connector HTTPS admin port). The user account must have the required authorizations and password.
The following table lists the SAP Cloud Connector user roles and their authorizations:
User role | Authorization |
|---|---|
| Administrate the Cloud Connector (all operations and settings) |
|
|
| Access the Cloud Connector administration UI in read-only mode. |
|
|
| Access the monitoring APIs. Primarily used by the SAP Solution Manager infrastructure. |
Set up connection to remote database
If you didn't complete this step during pre-installation, complete it now.
- Open SAP transaction
DBACOCKPITto verify connections to remote HANA databases. - Create a database connection for each remote HANA database you want to monitor.
- For detailed instructions, see Create Database Connection.
Configure connections to New Relic API endpoints
You can configure multiple New Relic accounts in this section.
Click New Entries.
Enter your New Relic account details:
- New Relic Account ID (optionally prefixed with SAP-)
API Ingest Key
- Metric Endpoint (see Network endpoints)
Event Endpoint
Log Endpoint
Trace Endpoint
Click Save.

Copy template tables from client 000
Click the execute icon (clock symbol) to copy the template tables from client 000. Verify that a success message appears.
Monitoring groups reference
The following table lists the data providers in each monitoring group and the system types they apply to.
Monitor group | Included data providers | Applied to system type | Special notes |
|---|---|---|---|
BIZ_DOC | Change document event for business objects | ECC systems and S/4 HANA | |
BTP_APIM | BTP IntegrationSuite API Management | BTP | Requires API Management, API Portal Services Subscriptions |
BTP_IS | BTP IntegrationSuite Message Log via BTP platform API | BTP | Requires Process Integration Runtime Service subscription |
CALM | CloudALM Monitoring Subjects, such as Health Monitoring, Integration and Exception Monitoring | BTP/CloudALM | |
CALM_LMS | Landscape Monitoring, API Connection Check | BTP/CloudALM | |
CF | Cloud Foundry | BTP/CloudALM | |
DB_KPI | Key Performance Indicators for databases, such as availability, space, etc. | All Systems, except HANA Database | |
HANA_DB | HANA Database data providers connect directly to the HANA DB | All HANA databases | Requires Database Connection |
HOST | Host metrics such as CPU, Memory, Disk Usage | All ABAP Systems | |
IDOC | IDOC events | ECC systems and S/4 HANA | |
MAXDB | Metrics for MAXDB database | Systems with MAXDB | |
MS_SQL | Metrics for Microsoft SQL Server database | Systems with Microsoft SQL Server | |
Oracle | Metrics for Oracle Database | Systems with Oracle Database | |
SAP_APPL | Events, Logs, Metrics, and Traces for SAP Application Monitoring such as RFCs, Jobs, Transactions, etc. | All ABAP Systems | |
SAP_CC | SAP Cloud Connector | SAP Cloud Connector | |
SAP_ST03N | SAP Performance Workload | All ABAP Systems | |
SAP_SYSTEM | Metrics for SAP System and application server instances, monitoring such as User, System Performances, etc. | All ABAP Systems | |
CUSTOM | Any data provider added by the customer |
팁
Manage the list of Monitoring Groups by navigating to Expert Mode > Installation Setups > Monitoring Group Maintenance. You can also add new monitoring groups from this section. For a complete list of data providers in each monitoring group, see the Data Providers Reference.
Define the monitored systems
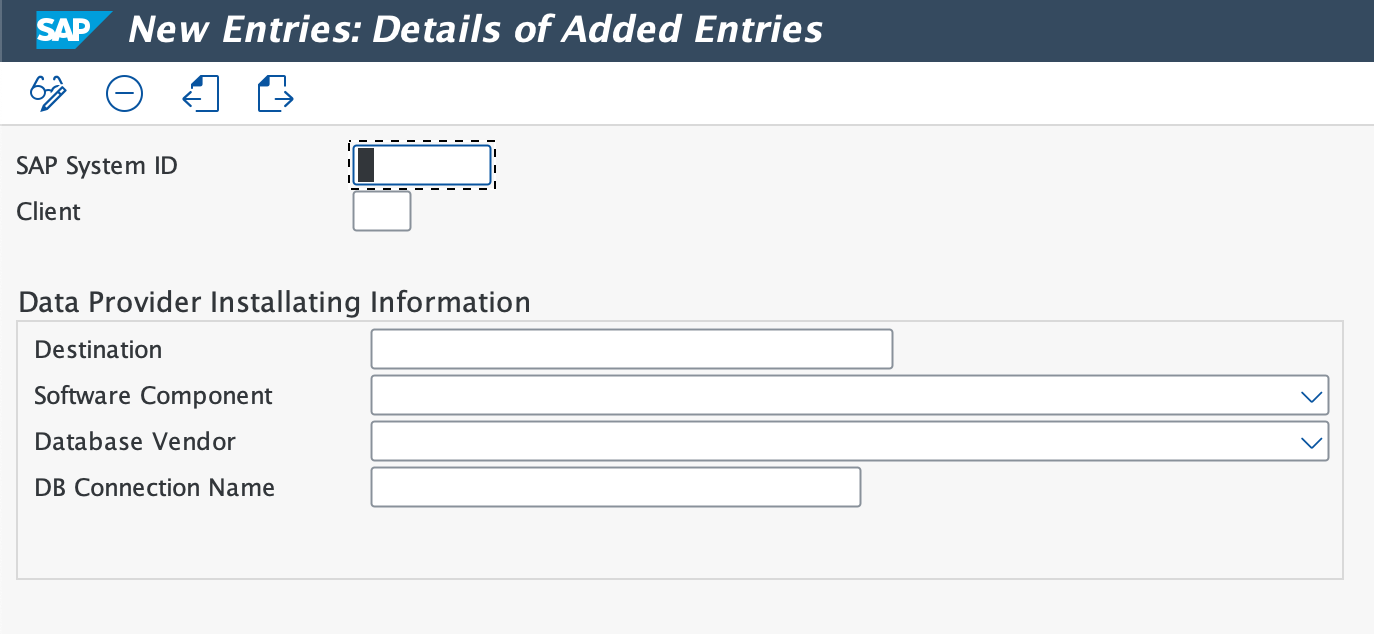
Click New Entries and enter the SAP System ID and Client number.
In Data Provider Installation Information, provide the following:
RFC Destination
SAP Software Component
Database Vendor
- DB Connection Name (HANA databases only)
- New Relic Account ID (optional) — if provided, data from this system goes only to that account, overriding the account in the collection manager job variant. If left blank, the system uses the collection manager job variant account.
Click Monitoring Group and select Yes to confirm.
Choose the required monitoring groups and click the generate icon.
Click BACK or press F3 to continue.
BTP/CALM accounts
When BTP monitoring is active, add BTP/CALM accounts as monitored systems. Use the following values:
- SAP System ID: Use a pseudonym or alias. Do not use reserved terms such as
CALMorBTP. - Client: Leave blank.
- Destination: Enter the authentication HTTP destination.
- Software Component: Leave blank.
- Database Vendor: Leave blank.
- DB Connection Name: Leave blank.
- New Relic Account ID: Enter the specific New Relic account designated to receive the data.
- API Host: Enter the API host name. This corresponds to the
urlvalue in the service key.
On the next screen, click Monitoring Group. Choose the appropriate monitoring groups for the system and click Finish.
Check RFC destinations
Use this option to verify the RFC destinations for the New Relic API endpoints and each monitored system. This test excludes the RFC destination designated as NONE.
Generate configuration
Generate configurations for new data providers
Run this option to generate all new data providers for a new release or patch. For fresh installations, this single step generates all data providers.
On the first screen, confirm the release and patch details. If the installation release and patch fields are blank, the configuration is already established.
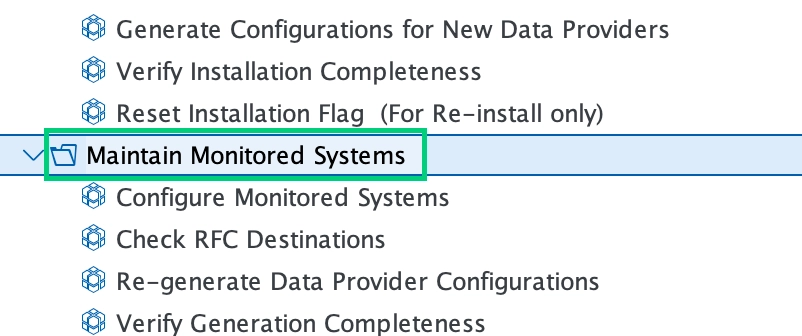
To regenerate configurations, navigate to Maintain Monitored Systems and select Re-generate Data Provider Configurations. You can also select Reset Installation Flag (For Re-install only) to clear the current installation flag and regenerate.
팁
For data providers based on CALM, see Generate Registry Entries for CALM Data Providers.
Verify installation completeness
Select Verify Installation Completeness. If any component shows a red indicator, click the execution button in the Action Needed column to resolve the issue.
Verify configuration
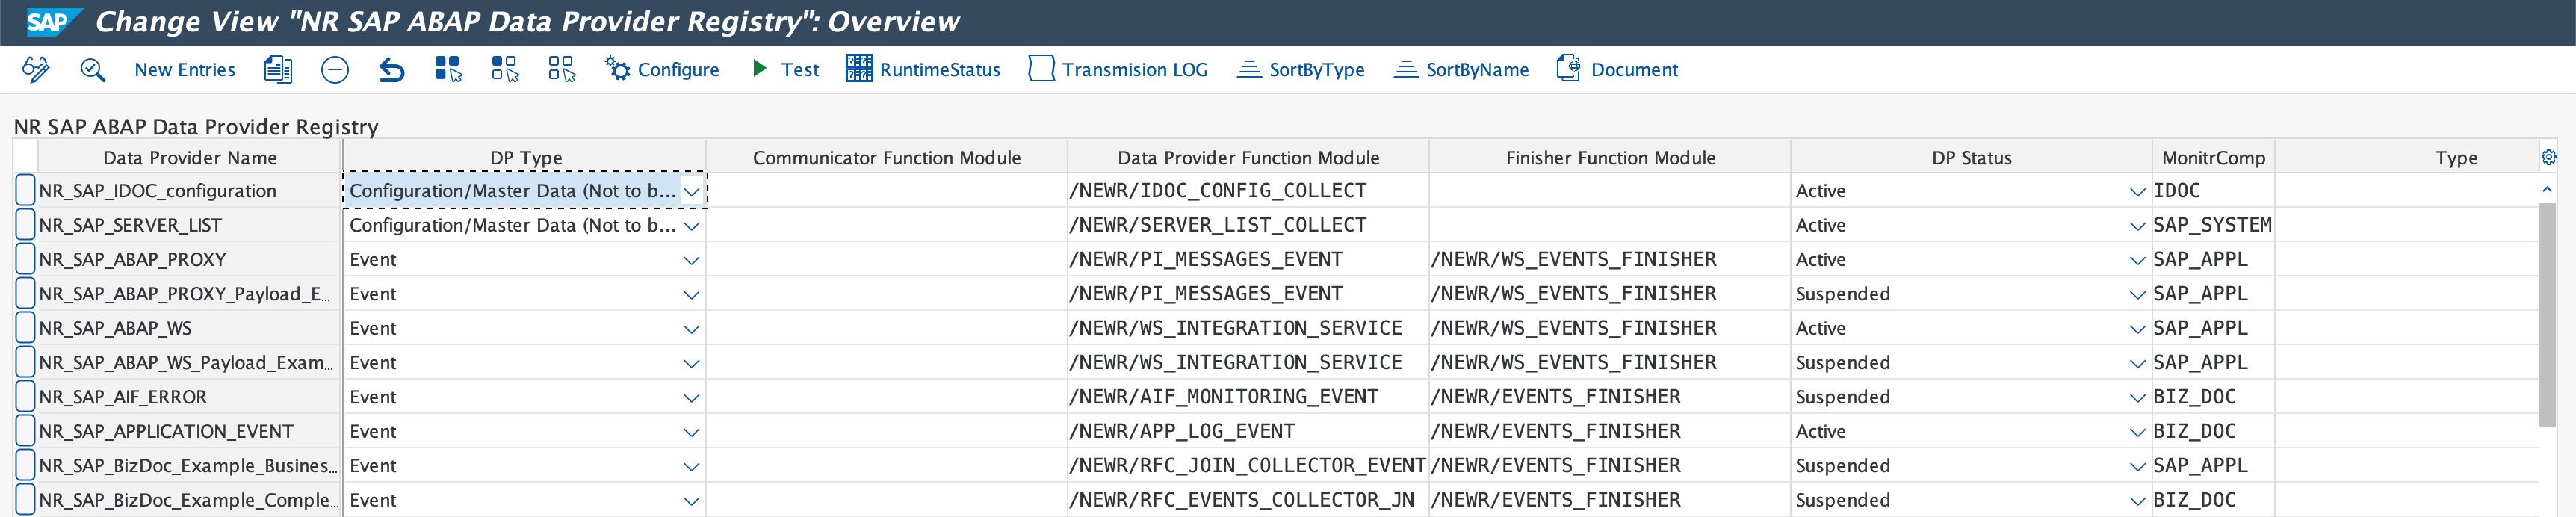
Open the Data Provider Registry Maintenance folder.
Click Data Provider Registry, or use transaction
/n/NEWR/REGISTRY.Select a Data Provider Name and click Configure to check the configuration settings, or click Test to verify the provider's functionality.
Click RuntimeStatus and remove all entries in the Runtime status screen.
Next steps
After verifying your configuration, schedule the collection jobs.